Feed aggregator
Kubernetes v1.36: Advancing Workload-Aware Scheduling
AI/ML and batch workloads introduce unique scheduling challenges that go beyond simple Pod-by-Pod scheduling. In Kubernetes v1.35, we introduced the first tranche of workload-aware scheduling improvements, featuring the foundational Workload API alongside basic gang scheduling support built on a Pod-based framework, and an opportunistic batching feature to efficiently process identical Pods.
Kubernetes v1.36 introduces a significant architectural evolution by cleanly separating API concerns:
the Workload API acts as a static template, while the new PodGroup API handles the runtime state.
To support this, the kube-scheduler features a new PodGroup scheduling cycle that enables atomic workload processing
and paves the way for future enhancements. This release also debuts the first iterations of topology-aware scheduling
and workload-aware preemption to advance scheduling capabilities. Additionally,
ResourceClaim support for workloads unlocks Dynamic Resource Allocation
(DRA) for PodGroups. Finally,
to demonstrate real-world readiness, v1.36 delivers the first phase of integration between the Job controller and the new API.
Workload and PodGroup API updates
The Workload API now serves as a static template, while the new PodGroup API describes the runtime object.
Kubernetes v1.36 introduces the Workload and PodGroup APIs as part of the
scheduling.k8s.io/v1alpha2 API group,
completely replacing the previous v1alpha1 API version.
In v1.35, Pod groups and their runtime states were embedded within the Workload resource. The new model decouples these concepts: the Workload now serves as a static template object, while the PodGroup manages the runtime state. This separation also improves performance and scalability as the PodGroup API allows per-replica sharding of status updates.
Because the Workload API acts merely as a template, the kube-scheduler's logic is streamlined.
The scheduler can directly read the PodGroup, which contains all the information required by the scheduler,
without needing to watch or parse the Workload object itself.
Here is what the updated configuration looks like. Workload controllers (such as the Job controller) define the Workload object, which now acts as a static template for your Pod groups:
apiVersion: scheduling.k8s.io/v1alpha2
kind: Workload
metadata:
 name: training-job-workload
 namespace: some-ns
spec:
 # Pod groups are now defined as templates,
 # which contains the PodGroup objects' spec fields.
 podGroupTemplates:
 - name: workers
 schedulingPolicy:
 gang:
 # The gang is schedulable only if 4 pods can run at once
 minCount: 4
Controllers then stamp out runtime PodGroup instances based on those templates. The PodGroup runtime object holds the actual scheduling policy and references the template from which it was created. It also has a status containing conditions that mirror the states of individual Pods, reflecting the overall scheduling state of the group:
apiVersion: scheduling.k8s.io/v1alpha2
kind: PodGroup
metadata:
 name: training-job-workers-pg
 namespace: some-ns
spec:
 # The PodGroup references the Workload template it originated from.
 # In comparison, .metadata.ownerReferences points to the "true" workload object,
 # e.g., a Job.
 podGroupTemplateRef:
 workload:
 workloadName: training-job-workload
 podGroupTemplateName: workers
 # The actual scheduling policy is placed inside the runtime PodGroup
 schedulingPolicy:
 gang:
 minCount: 4
status:
 # The status contains conditions mirroring individual Pod conditions.
 conditions:
 - type: PodGroupScheduled
 status: "True"
 lastTransitionTime: 2026-04-03T00:00:00Z
Finally, to bridge this new architecture with individual Pods, the workloadRef field in the Pod API has been replaced
with the schedulingGroup field. When creating Pods, you link them directly to the runtime PodGroup:
apiVersion: v1
kind: Pod
metadata:
 name: worker-0
 namespace: some-ns
spec:
 # The workloadRef field has been replaced by schedulingGroup
 schedulingGroup:
 podGroupName: training-job-workers-pg
 ...
By keeping the Workload as a static template and elevating the PodGroup to a first-class, standalone API, we establish a robust foundation for building advanced workload scheduling capabilities in future Kubernetes releases.
PodGroup scheduling cycle and gang scheduling
To efficiently manage these workloads, the kube-scheduler now features a dedicated PodGroup scheduling cycle. Instead of evaluating and reserving resources sequentially Pod-by-Pod, which risks scheduling deadlocks, the scheduler evaluates the group as a unified operation.
When the scheduler pops a PodGroup member from the scheduling queue, regardless of the group's specific policy, it fetches the rest of the queued Pods for that group, sorts them deterministically, and executes an atomic scheduling cycle as follows:
-
The scheduler takes a single snapshot of the cluster state to prevent race conditions and ensure consistency while evaluating the entire group.
-
It then attempts to find valid Node placements for all Pods in the group using a PodGroup scheduling algorithm, which leverages the standard Pod-based filtering and scoring phases.
-
Based on the algorithm's outcome, the scheduling decision is applied atomically for the entire PodGroup.
-
Success: If the placement is found and group constraints are met, the schedulable member Pods are moved directly to the binding phase together. Any remaining unschedulable Pods are returned to the scheduling queue to wait for available resources so they can join the already scheduled Pods.
(Note: If new Pods are added to a PodGroup after others are already scheduled, the cycle evaluates the new Pods while accounting for the existing ones. Crucially, Pods already assigned to Nodes remain running. The scheduler will not unassign or evict them, even if the group fails to meet its requirements in subsequent cycles.)
-
Failure: If the group fails to meet its requirements, the entire group is considered unschedulable. None of the Pods are bound, and they are returned to the scheduling queue to retry later after a backoff period.
-
This cycle acts as the foundation for gang scheduling. When your workload requires strict all-or-nothing placement,
the gang policy leverages this cycle to prevent partial deployments that lead to resource wastage and potential deadlocks.
While the scheduler still holds the Pods in the PreEnqueue until the minCount requirement is met, the actual scheduling phase now relies entirely
on the new PodGroup cycle. Specifically, during the algorithm's execution, the scheduler verifies
that the number of schedulable Pods satisfies the minCount. If the cluster cannot accommodate the required minimum,
none of the pods are bound. The group fails and waits for sufficient resources to free up.
Limitations
The first version of the PodGroup scheduling cycle comes with certain limitations:
-
For basic homogeneous Pod groups (i.e., those where all Pods have identical scheduling requirements and lack inter-Pod dependencies like affinity, anti-affinity, or topology spread constraints), the algorithm is expected to find a placement if one exists.
-
For heterogeneous Pod groups, finding a valid placement if one exists is not guaranteed, even when the solution might seem trivial.
-
For Pod groups with inter-Pod dependencies, finding a valid placement if one exists is not guaranteed.
In addition to the above, for cases involving intra-group dependencies (e.g., when the schedulability of one Pod depends on another group member via inter-Pod affinity), this algorithm may fail to find a placement regardless of cluster state due to its deterministic processing order.
Topology-aware scheduling
For complex distributed workloads like AI/ML training or batch processing, placing Pods randomly across a cluster can introduce significant network latency and bottleneck overall performance.
Topology-aware scheduling addresses this problem by allowing you to define topology constraints directly on a PodGroup, ensuring its Pods are co-located within specific physical or logical domains:
apiVersion: scheduling.k8s.io/v1alpha2
kind: PodGroup
metadata:
 name: topology-aware-workers-pg
spec:
 schedulingPolicy:
 gang:
 minCount: 4
 # Enforce that the pods are co-located based on the rack topology
 schedulingConstraints:
 topology:
 - key: topology.kubernetes.io/rack
In this example, the kube-scheduler attempts to schedule the Pods across various combinations of Nodes
that match the rack topology constraint. It then selects the optimal placement based on how efficiently
the PodGroup utilizes resources and how many Pods can successfully be scheduled within that domain.
To achieve this, the scheduler extends the PodGroup scheduling cycle with a dedicated placement-based algorithm consisting of three phases:
-
Generate candidate placements (subsets of Nodes that are theoretically feasible for the PodGroup's assignment) based on the group's scheduling constraints. The topology-aware scheduling plugin uses the new
PlacementGenerateextension point to create these placements. -
Evaluate each proposed placement to confirm whether the entire PodGroup can actually fit there.
-
Score all feasible placements to select the best fit for the PodGroup. The topology-aware scheduling plugins use the new
PlacementScoreextension point to score these placements.
Currently, topology-aware scheduling does not trigger Pod preemption to satisfy constraints. However, we plan to integrate workload-aware preemption with topology constraints in the upcoming release.
While Kubernetes v1.36 delivers this foundational topology-aware scheduling, the Kubernetes project is planning
expand its capabilities soon. Future updates will introduce support for multiple topology levels,
soft constraints (preferences), deeper integration with Dynamic Resource Allocation (DRA),
and more robust behavior when paired with the basic scheduling policy.
Workload-aware preemption
To support the new PodGroup scheduling cycle, Kubernetes v1.36 introduces a new type of preemption mechanism called workload-aware preemption. When a PodGroup cannot be scheduled, the scheduler utilizes this mechanism to try making a scheduling of this PodGroup possible.
Compared to the default preemption used in the standard Pod-by-Pod scheduling cycle, this new mechanism treats the entire PodGroup as a single preemptor unit. Instead of evaluating preemption victims on each Node separately, it searches across the entire cluster. This allows the scheduler to preempt Pods from multiple Nodes simultaneously, making enough space to schedule the whole PodGroup afterwards.
Workload-aware preemption also introduces two additional concepts directly to the PodGroup API:
-
PodGroup
prioritythat overrides the priority of the individual Pods forming the PodGroup. -
PodGroup
disruptionModethat dictates whether the Pods within a PodGroup can be preempted independently, or if they have to be preempted together in an all-or-nothing fashion.
In Kubernetes v1.36, these fields are only respected by the workload-aware preemption mechanism. The people working on this set of features are hoping to extend support for these fields to other disruption sources, including default preemption used in the Pod-by-Pod scheduling cycle, in future releases.
apiVersion: scheduling.k8s.io/v1alpha2
kind: PodGroup
metadata:
 name: victim-pg
spec:
 priorityClassName: high-priority
 priority: 1000
 disruptionMode: PodGroup
In this example, when the scheduler evaluates victim-pg as a potential preemption victim
during a workload-aware preemption cycle, it will use 1000 as its priority and preempt the PodGroup
in a strictly all-or-nothing fashion.
DRA ResourceClaim support for workloads
Since its general availability in Kubernetes v1.34, DRA has enabled Pods to make detailed requests for devices like GPUs, TPUs, and NICs. Requested devices can be shared by multiple Pods requesting the same ResourceClaim by name. Other requests can be replicated through a ResourceClaimTemplate, in which Kubernetes generates one ResourceClaim with a non-deterministic name for each Pod referencing the template. However, large-scale workloads that require certain Pods to share certain devices are currently left to manage creating individual ResourceClaims themselves.
Now, in addition to Pods, PodGroups can represent the replicable unit for a
ResourceClaimTemplate. For ResourceClaimTemplates referenced by one of a
PodGroup's spec.resourceClaims, Kubernetes generates one ResourceClaim for the
entire PodGroup, no matter how many Pods are in the group. When one of a Pod's
spec.resourceClaims for a ResourceClaimTemplate matches one of its PodGroup's
spec.resourceClaims, the Pod's claim resolves to the ResourceClaim generated
for the PodGroup and a ResourceClaim will not be generated for that individual
Pod. A single PodGroupTemplate in a Workload object can express resource
requests which are both copied for each distinct PodGroup and shareable by the
Pods within each group.
The following example shows two Pods requesting the same ResourceClaim generated from a ResourceClaimTemplate for their PodGroup:
apiVersion: scheduling.k8s.io/v1alpha2
kind: PodGroup
metadata:
 name: training-job-workers-pg
spec:
 ...
 resourceClaims:
 - name: pg-claim
 resourceClaimTemplateName: my-claim-template
---
apiVersion: v1
kind: Pod
metadata:
 name: topology-aware-workers-pg-pod-1
spec:
 ...
 schedulingGroup:
 podGroupName: training-job-workers-pg
 resourceClaims:
 - name: pg-claim
 resourceClaimTemplateName: my-claim-template
---
apiVersion: v1
kind: Pod
metadata:
 name: topology-aware-workers-pg-pod-2
spec:
 ...
 schedulingGroup:
 podGroupName: training-job-workers-pg
 resourceClaims:
 - name: pg-claim
 resourceClaimTemplateName: my-claim-template
In addition, ResourceClaims referenced by PodGroups, either through
resourceClaimName or the claim generated from resourceClaimTemplateName,
become reserved for the entire PodGroup. Previously, kube-scheduler could only
list individual Pods in a ResourceClaim's status.reservedFor field which is
limited to 256 items. Now, a single PodGroup reference in status.reservedFor
can represent many more than 256 Pods, allowing high-cardinality sharing of
devices.
Together, these changes enable massive workloads with complex topologies to utilize DRA for scalable device management.
Integration with the Job controller
In Kubernetes v1.36, the Job controller can create and manage Workload and PodGroup objects on your behalf, so that Jobs representing a tightly coupled parallel application, such as distributed AI training, are gang-scheduled without any additional tooling. Without this integration, you would have to create the Workload and PodGroup yourself and wire their references into the Pod template. Now, the Job controller automates this process natively.
When the WorkloadWithJob
feature gate is enabled, the Job controller automatically:
-
creates a Workload and a corresponding runtime PodGroup for each qualifying Job,
-
sets
.spec.schedulingGrouponto every Pod the Job creates so the scheduler treats them as a single gang, and -
sets the Job as the owner of the generated objects, so they are garbage-collected when the Job is deleted.
When does the integration kick in?
To keep the first feature iteration predictable, the Job controller only creates a Workload and PodGroup when the Job has a well-defined, fixed shape:
-
.spec.parallelismis greater than 1 -
.spec.completionModeis set toIndexed -
.spec.completionsis equal to.spec.parallelism -
The
schedulingGroupis not already set on the Pod template.
These conditions describe the class of Jobs that gang scheduling can reason about:
each Pod has a stable identity (Indexed), the gang size is known and fixed at admission time
(parallelism == completions), and no other controller has already claimed scheduling responsibility
(schedulingGroup field is unset). Jobs that do not meet these conditions are scheduled Pod-by-Pod,
exactly as before.
If you set schedulingGroup on the Pod template yourself (for example,
because a higher-level controller is managing the workload), the Job controller leaves
the Pod template alone and does not create its own Workload or PodGroup. This makes the feature
safe to enable in clusters that already use an external batch system.
Here is an example of a Job that qualifies for gang scheduling:
apiVersion: batch/v1
kind: Job
metadata:
 name: training-job
 namespace: job-ns
spec:
 completionMode: Indexed
 parallelism: 4
 completions: 4
 template:
 spec:
 restartPolicy: Never
 containers:
 - name: worker
 image: registry.example/trainer:latest
The Job controller creates a Workload and a PodGroup owned by this Job,
and every Pod it creates carries a .spec.schedulingGroup that points at the generated PodGroup.
The Pods are then scheduled together once all four can be placed at the same time using
the PodGroup scheduling cycle described earlier in this post.
What's not covered yet
The current constraints limit this integration to static, indexed, fully-parallel Jobs. Support for additional workload shapes, including elastic Jobs and other built-in controllers, is tracked in KEP-5547.
In future Kubernetes releases, this integration will expand to support additional workload controllers, and the current constraints for Jobs may be relaxed.
What's next?
The journey for workload-aware scheduling doesn't stop here. For v1.37, the community is actively working on:
-
Graduating Workload and PodGroup APIs to Beta: Our primary goal is to mature the Workload and PodGroup APIs to the Beta stage, solidifying their foundational role in the Kubernetes ecosystem. As part of this graduation process, we also plan to introduce
minCountmutability to unlock elastic jobs and allow dynamic workloads to scale efficiently. -
Multi-level Workload hierarchies: To support complex modern AI workloads like JobSet or Disaggregated Inference via LeaderWorkerSet (LWS), we are working on expanding the architecture to support multi-level hierarchies. We aim to introduce a new API that allows grouping multiple PodGroups into hierarchical structures, directly reflecting the organization of real-world workload controllers.
-
Graduating advanced scheduling features: We are focused on driving the maturity of the broader workload-aware scheduling ecosystem. This includes bringing existing features, such as topology-aware scheduling and workload-aware preemption, to the Beta stage.
-
Unified controller integration API: To streamline adoption, we’re working on a controller integration API. This will provide real-world workload controllers with a unified, standardized method for consuming workload-aware scheduling capabilities.
The priority and implementation order of these focus areas are subject to change. Stay tuned for further updates.
Getting started
All below workload-aware scheduling improvements are available as Alpha features in v1.36. To try them out, you must configure the following:
- Prerequisite: Workload and PodGroup API support: Enable the
GenericWorkloadfeature gate on both thekube-apiserverandkube-scheduler, and ensure thescheduling.k8s.io/v1alpha2API group is enabled.
Once the prerequisite is met, you can enable specific features:
- Gang scheduling: Enable the
GangSchedulingfeature gate on thekube-scheduler. - Topology-aware scheduling: Enable the
TopologyAwareWorkloadSchedulingfeature gate on thekube-scheduler. - Workload-aware preemption: Enable the
WorkloadAwarePreemptionfeature gate on thekube-scheduler(requiresGangSchedulingto also be enabled). - DRA ResourceClaim support for workloads: Enable the
DRAWorkloadResourceClaimsfeature gate on thekube-apiserver,kube-controller-manager,kube-schedulerandkubelet. - Workload API integration with the Job controller: Enable the
WorkloadWithJobfeature gate on thekube-apiserverandkube-controller-manager.
We encourage you to try out workload-aware scheduling in your test clusters and share your experiences to help shape the future of Kubernetes scheduling. You can send your feedback by:
- Reaching out via Slack (#workload-aware-scheduling).
- Joining the SIG Scheduling meetings.
- Filing a new issue in the Kubernetes repository.
Learn more
To dive deeper into the architecture and design of these features, read the KEPs:
OpenAI’s GPT-5.5 is as Good as Mythos at Finding Security Vulnerabilities
The UK’s AI Security Institute evaluated GPT-5.5’s ability to find security vulnerabilities, and found that it is comparable to Claude Mythos. Note that the OpenAI model is generally available.
Here is the Institute’s evaluation of Mythos.
And here is an analysis of a smaller, cheaper model. It requires more scaffolding from the prompter, but it is also just as good.
Kubernetes at Uber with Lucy Sweet
Guest is Lucy Sweet, a Staff Software engineer at Uber and the lead for the Kubernetes Node Lifecycle Working Group. Imagine trying to move millions of compute cores and thousands of microservices to a brand new platform. All without dropping a single user request, ride, or delivery. Sounds like an absolute logistical nightmare, right? Well, today we are sitting down with someone who actually lived to tell the tale Lucy. In this episode, we are diving deep into Uber's monumental infrastructure journey: moving away from their in-house system to Kubernetes. We'll be unpacking the reality of running at this scale, why it's always DNS and why building things for fun is worth it.
Do you have something cool to share? Some questions? Let us know:
- web: kubernetespodcast.com
- mail: [email protected]
- twitter: @kubernetespod
- bluesky: @kubernetespodcast.com
News of the week
-
Broadcom announced donating Velero to the CNCF Sandbox Level
-
KubeCon && CloudNativeCon Amsterdam 2026 Transparency report
-
Call for Proposals for KubeCon && CloudNativeCon North America 2026 closes May 31
Reducing CVE fatigue with Red Hat Hardened Images and Anchore
Patch Tuesday, May 2026 Edition
Artificial intelligence platforms may be just as susceptible to social engineering as human beings, but they are proving remarkably good at finding security vulnerabilities in human-made computer code. That reality is on full display this month with some of the more widely-used software makers — including Apple, Google, Microsoft, Mozilla and Oracle — fixing near record volumes of security bugs, and/or quickening the tempo of their patch releases.
As it does on the second Tuesday of every month, Microsoft today released software updates to address at least 118 security vulnerabilities in its various Windows operating systems and other products. Remarkably, this is the first Patch Tuesday in nearly two years that Microsoft is not shipping any fixes to deal with emergency zero-day flaws that are already being exploited. Nor have any of the flaws fixed today been previously disclosed (potentially giving attackers a heads up in how to exploit the weakness).
Sixteen of the vulnerabilities earned Microsoft’s most-dire “critical” label, meaning malware or miscreants could abuse these bugs to seize remote control over a vulnerable Windows device with little or no help from the user. Rapid7 has done much of the heavy lifting in identifying some of the more concerning critical weaknesses this month, including:
- CVE-2026-41089: A critical stack-based buffer overflow in Windows Netlogon that offers an attacker SYSTEM privileges on the domain controller. No privileges or user interaction are required, and attack complexity is low. Patches are available for all versions of Windows Server from 2012 onwards.
- CVE-2026-41096: A critical RCE in the Windows DNS client implementation worthy of attention despite Microsoft assessing exploitation as less likely.
- CVE-2026-41103: A critical elevation of privilege vulnerability that allows an unauthorized attacker to impersonate an existing user by presenting forged credentials, thus bypassing Entra ID. Microsoft expects that exploitation is more likely.
May’s Patch Tuesday is a welcome respite from April, which saw Microsoft fix a near-record 167 security flaws. Microsoft was among a few dozen tech giants given access to a “Project Glasswing,” a much-hyped AI capability developed by Anthropic that appears quite effective at unearthing security vulnerabilities in code.
Apple, another early participant in Project Glasswing, typically fixes an average of 20 vulnerabilities each time it ships a security update for iOS devices, said Chris Goettl, vice president of product management at Ivanti. On May 11, Apple shipped updates to address at least 52 vulnerabilities and backported the changes all the way to iPhone 6s and iOS 15.
Last month, Mozilla released Firefox 150, which resolved a whopping 271 vulnerabilities that were reportedly discovered during the Glasswing evaluation.
“Since Firefox 150.0.0 released, they have been on a more aggressive weekly cadence for security updates including the release of Firefox 150.0.3 on May Patch Tuesday resolving between three to five CVEs in each release,” Goettl said.
The software giant Oracle likewise recently increased its patch pace in response to their work with Glasswing. In its most recent quarterly patch update, Oracle addressed at least 450 flaws, including more than 300 fixes for remotely exploitable, unauthenticated flaws. But at the end of April, Oracle announced it was switching to a monthly update cycle for critical security issues.
On May 8, Google started rolling out updates to its Chrome browser that fixed an astonishing 127 security flaws (up from just 30 the previous month). Chrome automagically downloads available security updates, but installing them requires fully restarting the browser.
If you encounter any weirdness applying the updates from Microsoft or any other vendor mentioned here, feel free to sound off in the comments below. Meantime, if you haven’t backed up your data and/or drive lately, doing that before updating is generally sound advice. For a more granular look at the Microsoft updates released today, checkout this inventory by the SANS Internet Storm Center.
Kubernetes v1.36: PSI Metrics for Kubernetes Graduates to GA
Since its original implementation in the Linux kernel in 2018, Pressure Stall Information (PSI) has provided users with the high-fidelity signals needed to identify resource saturation before it becomes an outage. Unlike traditional utilization metrics, PSI tells the story of tasks stalled and time lost, all in nicely-packaged percentages of time across the CPU, memory, and I/O.
With the recent release of Kubernetes v1.36, users across the ecosystem have a stable, reliable interface to observe resource contention at the node, pod, and container levels. In this post, we will dive into the improvements and performance testing that proved its readiness for production.
Beyond utilization: why PSI?
Monitoring CPU or memory usage alone can be misleading. A node may report XX% (below 100%) CPU utilization while certain tasks are experiencing severe latency due to scheduling delays. PSI fills this gap by providing:
- Cumulative Totals: Absolute time spent in a stalled state.
- Moving Averages: 10s, 60s, and 300s windows that allow operators to distinguish between transient spikes and sustained resource tension.
Proving stability: performance testing at scale
A common concern when graduating telemetry features is the resource overhead required to collect and serve the metrics. To address this, SIG Node conducted extensive performance validation on high-density workloads (80+ pods) across various machine types.
Our testing focused on two primary scenarios to isolate the impact of the Kubelet and kernel-level collection respectively:
- Kernel PSI ON / Kubelet Feature OFF vs Kernel PSI ON / Kubelet Feature ON (Kubelet overhead)
- Kernel PSI OFF / Kubelet Feature ON vs Kernel PSI ON / Kubelet Feature ON (Kernel overhead)
Scenario 1: The Kubelet Overhead
First, we looked at the kubelet usage on 4 core machines (Case 1). For these, the Linux kernel was already tracking pressure on both clusters by default(psi=1), but we toggled the KubeletPSI feature gate to see if the Kubelet actively querying and exposing these metrics impacted the resource usage. The synchronized bursts seen in the graph are practically identical in both magnitude and frequency, confirming that the Kubelet's collection logic is highly lightweight and blends seamlessly into standard housekeeping cycles. There is no issue about the feature affecting the pre-existing resource use, staying within the normal 0.1 cores or 2.5% of the total node capacity, and is therefore safe for production-scale deployments.

(Case 1) Kubelet CPU Usage Rate Comparison
Figure 2: Kubelet CPU Usage Rate Comparison.
Next, we evaluated the system overhead in the same run. As seen in the following graph, the System CPU usage lines for the Kubelet PSI-enabled (red) follows the same pattern as the Kubelet PSI-disabled (blue) clusters, with a slight expected increase from the baseline. This visualizes that once the OS is tracking PSI, at around 2.5 cores, the act of Kubernetes reading those cgroup metrics is negligible to performance.
(Case 1) System CPU Usage Rate Comparison
Figure 1: Node System CPU Usage Rate Comparison.
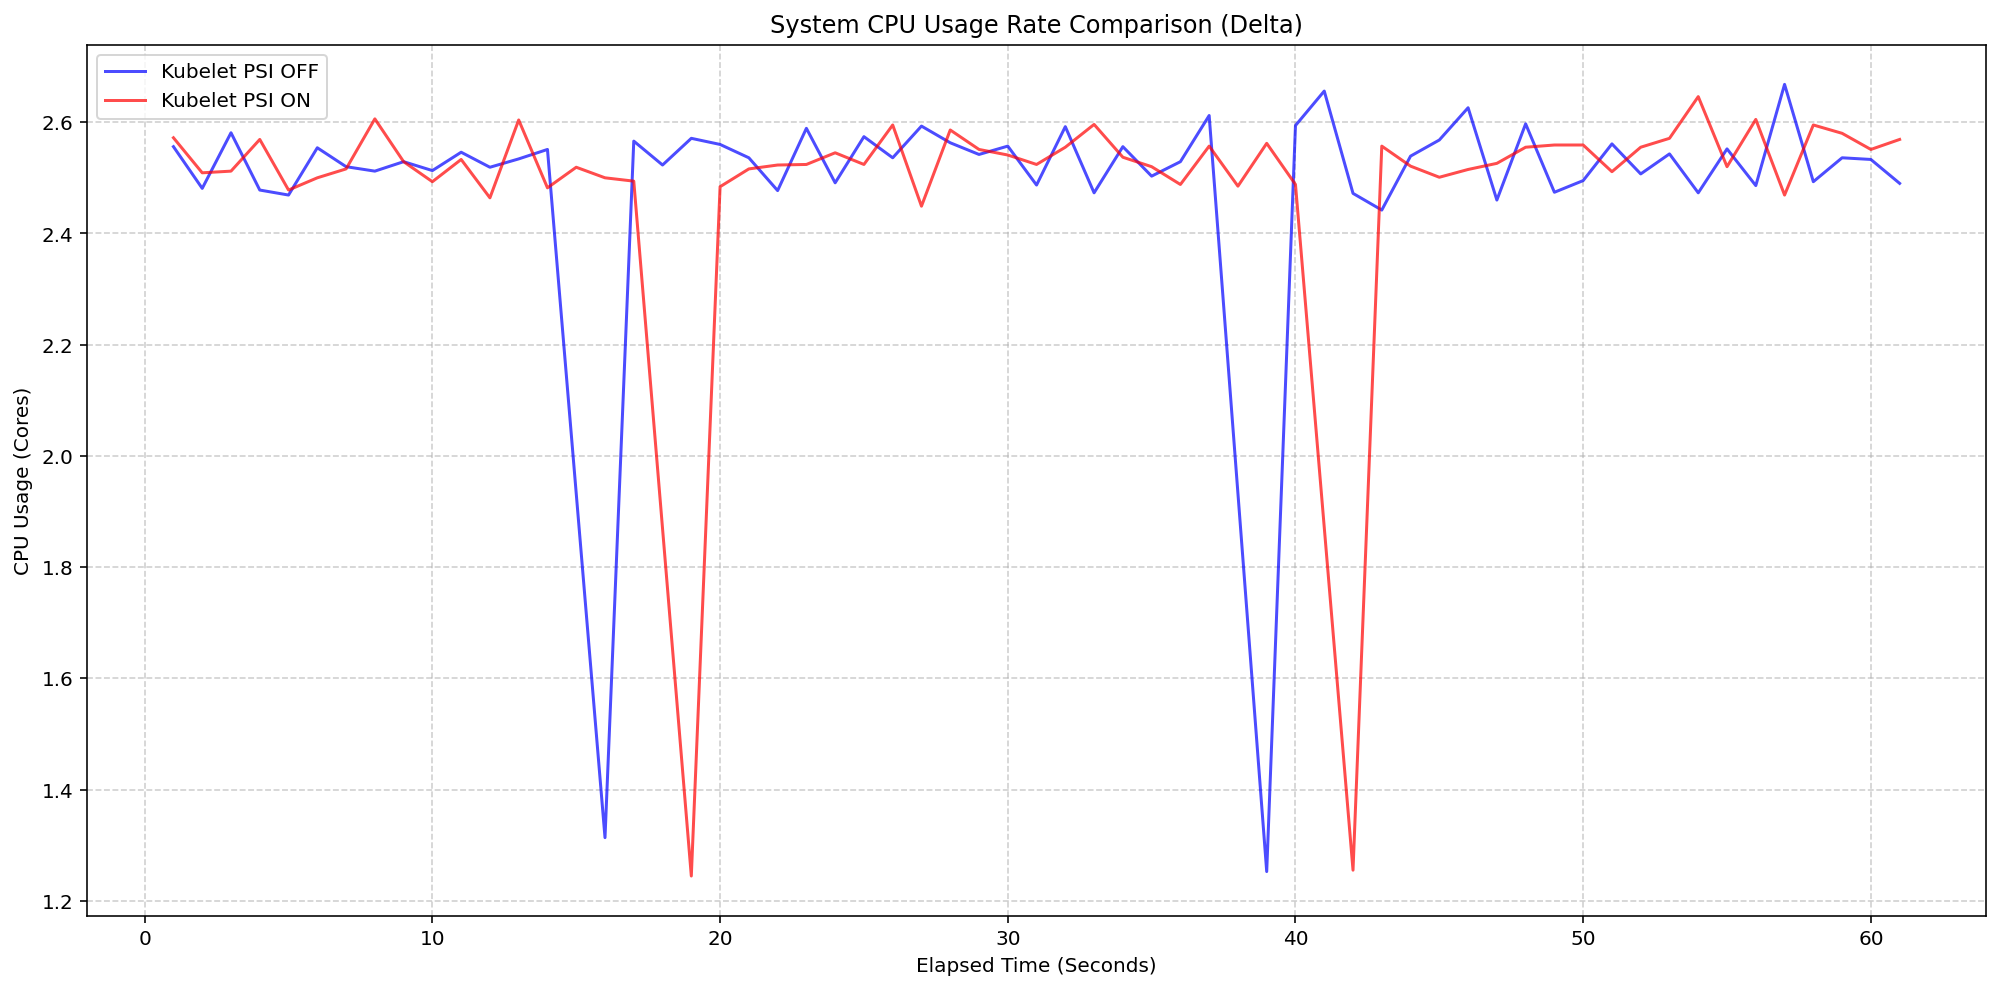
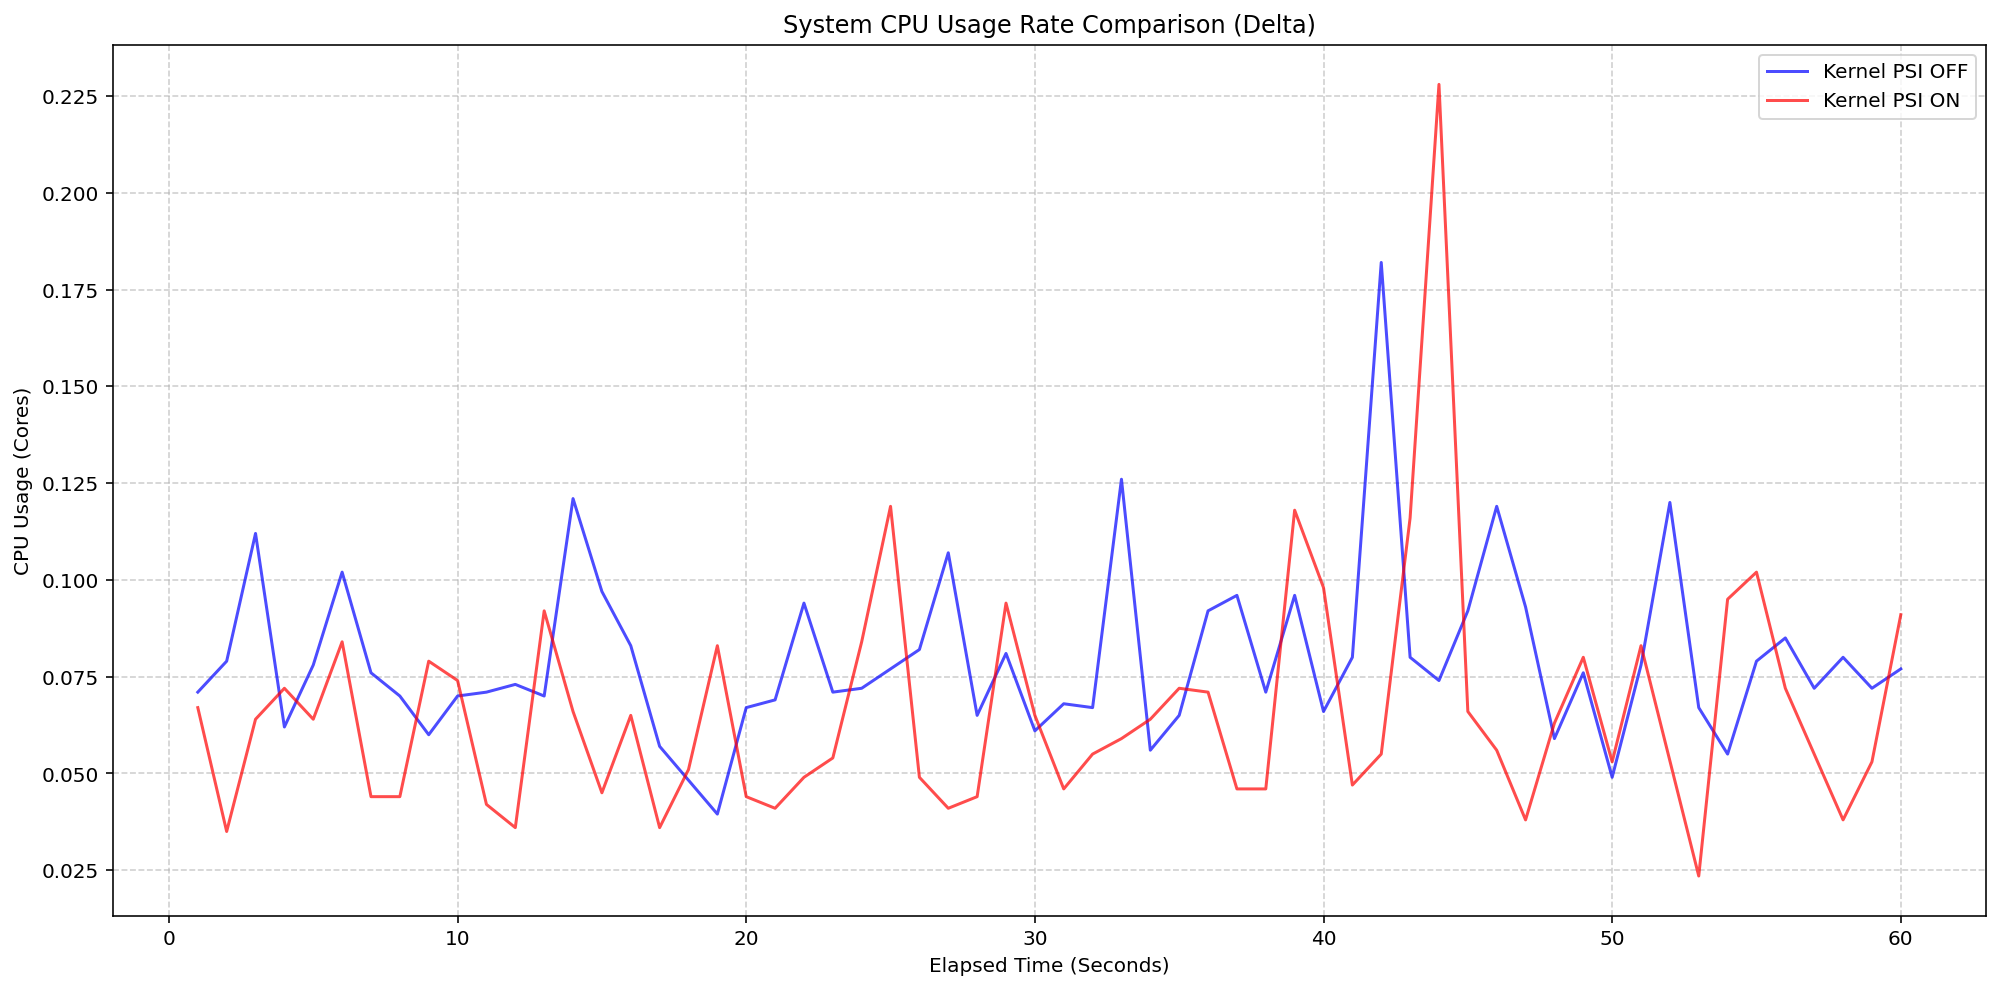
Scenario 2: The Kernel Overhead
Shifting gears, we evaluated the underlying overhead of enabling PSI on the Linux kernel also on a 4 core machine. By comparing a cluster booted with psi=1 (COS default) against a cluster with psi=0, we isolated the exact cost of the OS-level bookkeeping. Even under heavy I/O and CPU load at an 80-pod density, the System CPU delta between the kernel-enabled and kernel-disabled clusters remained consistently between 0.037 cores and 0.125 cores or 0.925% - 3.125% of the total node capacity. There was a single spike to 0.225 cores, or 5.6%, but was controlled back down within a few seconds. This confirms that the internal kernel tracking is highly efficient under load.
(Case 2) Node System CPU Usage Rate Comparison
Figure 3: Node System CPU Usage Rate Comparison.
Figure 4 zooms in on the kubelet process itself, which serves as the primary collector for these metrics. . The results show that even while the kubelet performs periodic sweeps to aggregate data from the cgroup hierarchy, its CPU usage remains remarkably low with interchangeable spikes and nothing exceeding 0.25 cores or 6.25% of total capacity for longer than a second.
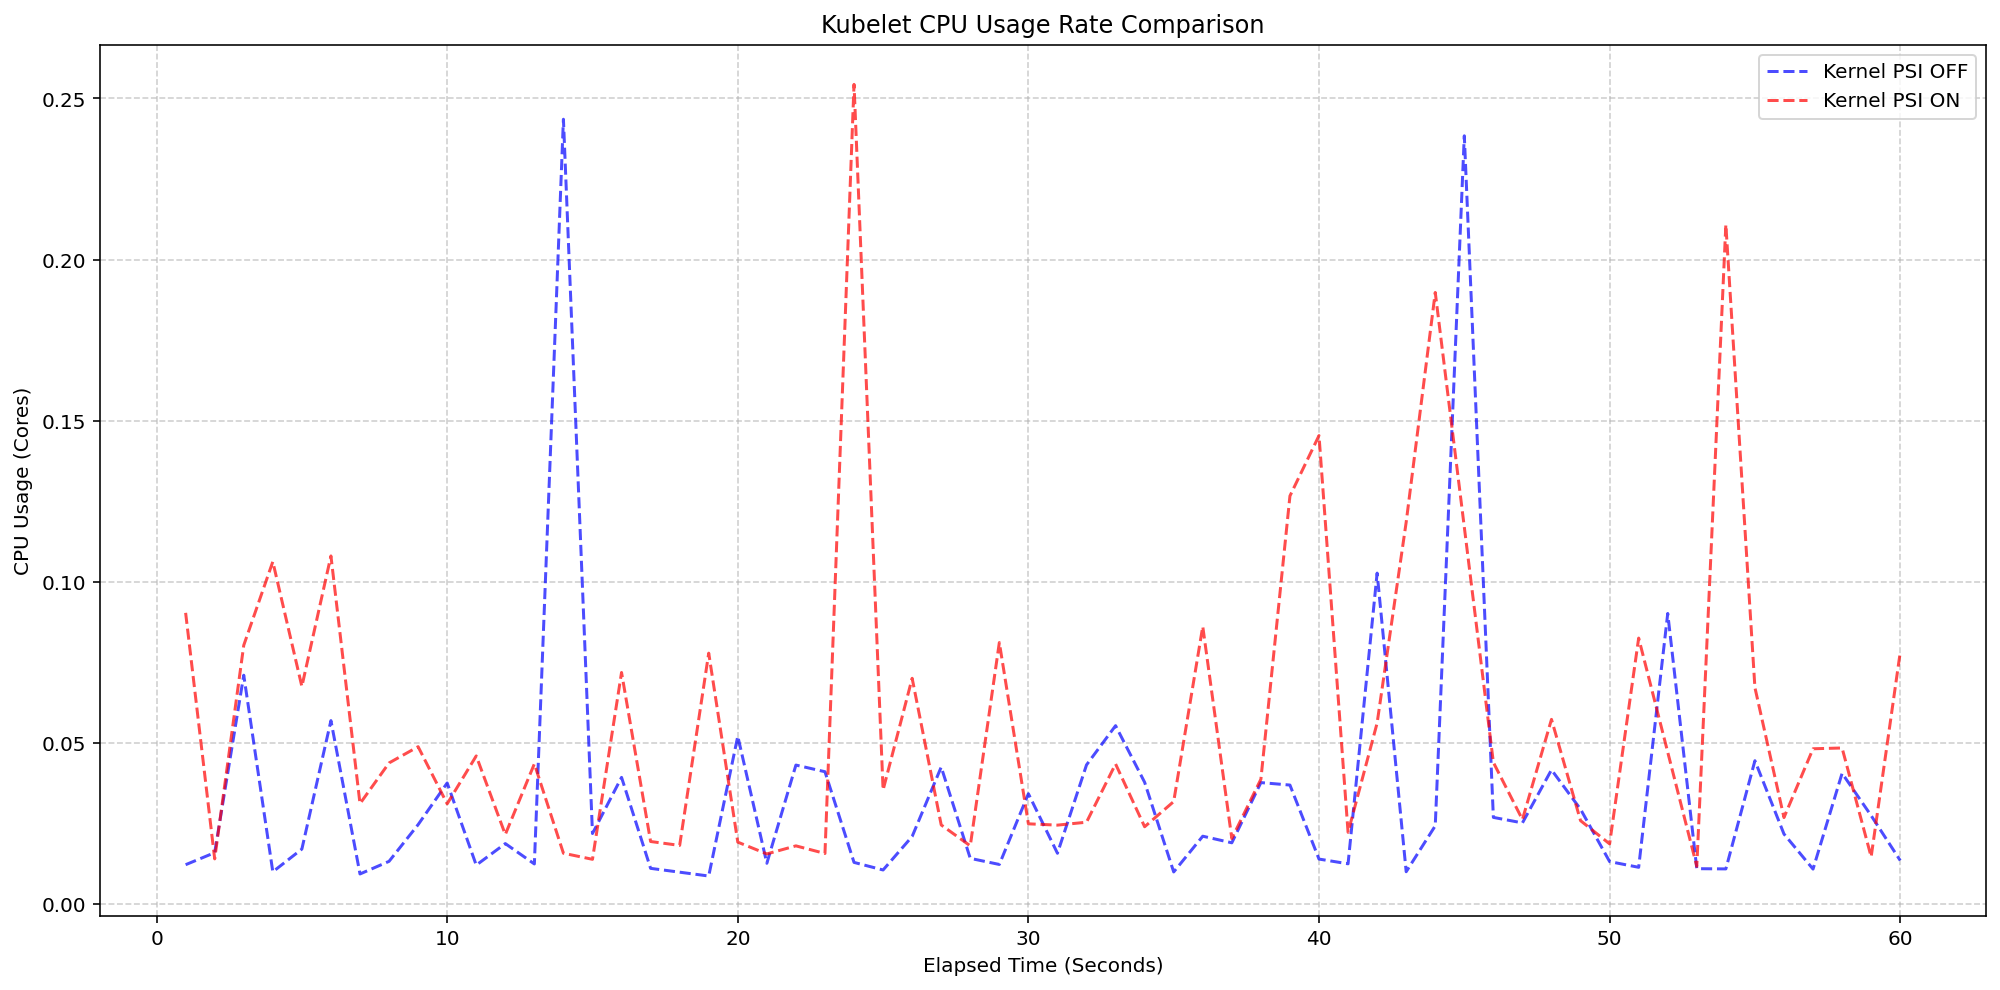
(Case 2) Kubelet CPU Usage Rate Comparison
Figure 4: Kubelet CPU Usage Rate Comparison.
Improvements between beta (1.34) and stable (1.36)
- Smarter Metric Emission for GA: We improved how the Kubelet handles underlying OS support for PSI. Previously, if the feature was enabled in Kubernetes but the underlying Linux kernel didn't support PSI (
psi=0), the Kubelet would emit misleading zero-valued metrics. These could trigger false alarms when read as real metrics instead of missing values. In v1.36, the Kubelet now detects OS-level PSI support via cgroup configurations before reporting. This ensures that pressure metrics are only collected and emitted when they are actually supported by the node, providing cleaner data for monitoring and alerting systems.
Getting started
To use PSI metrics in your Kubernetes cluster, your nodes must meet the following requirements:
- Ensure your nodes are running a Linux kernel version 4.20 or later and are using cgroup v2.
- Ensure PSI is enabled at the OS level (your kernel must be compiled with
CONFIG_PSI=yand must not be booted with thepsi=0parameter).
As of v1.36, Kubelet PSI metrics are generally available and you do not need to opt in to any feature gate.
Once the OS prerequisites are met, you can start scraping the /metrics/cadvisor endpoint with your Prometheus-compatible monitoring solution or query the Summary API to collect and visualize the new PSI metrics. Note that PSI is a Linux-kernel feature, so these metrics are not available on Windows nodes. Your cluster can contain a mix of Linux and Windows nodes, and on the Windows nodes, the kubelet will simply omit the PSI metrics.
If your cluster is running a recent enough version of Kubernetes and you are a privileged node administrator, you can also proxy to the kubelet's HTTP API via the control plane's API server to see real-time pressure data from the Summary API.
Caution: Proxying to the kubelet is a privileged operation. Granting access to it is a security risk, so ensure you have the appropriate administrative permissions before executing these commands.
CONTAINER_NAME="example-container"
kubectl get --raw "/api/v1/nodes/$(kubectl get nodes -o jsonpath='{.items[0].metadata.name}')/proxy/stats/summary" | jq '.pods[].containers[] | select(.name=="'"$CONTAINER_NAME"'") | {name, cpu: .cpu.psi, memory: .memory.psi, io: .io.psi}'
Further reading
If you want to dive deeper into how these metrics are calculated and exposed, check out these resources:
- The official Kernel documentation
- Understanding PSI in the Kubernetes documentation
- cAdvisor Metrics Implementation
Acknowledgements
Support for PSI metrics was developed through the collaborative efforts of SIG Node. Special thanks to all contributors who helped design, implement, test, review, and document this feature across its journey from alpha in v1.33, through beta in v1.34, to GA in v1.36.
To provide feedback on this feature, join the Kubernetes Node Special Interest Group, participate in discussions on the public Slack channel (#sig-node), or file an issue on GitHub.
Feedback
If you have feedback and want to share your experience using this feature, join the discussion:
- SIG Node community page
- Kubernetes Slack in the #sig-node channel
- SIG Node mailing list
SIG Node would love to hear about your experiences using this feature in production!
Kubernetes v1.36: PSI Metrics for Kubernetes Graduates to GA
Since its original implementation in the Linux kernel in 2018, Pressure Stall Information (PSI) has provided users with the high-fidelity signals needed to identify resource saturation before it becomes an outage. Unlike traditional utilization metrics, PSI tells the story of tasks stalled and time lost, all in nicely-packaged percentages of time across the CPU, memory, and I/O.
With the recent release of Kubernetes v1.36, users across the ecosystem have a stable, reliable interface to observe resource contention at the node, pod, and container levels. In this post, we will dive into the improvements and performance testing that proved its readiness for production.
Beyond utilization: why PSI?
Monitoring CPU or memory usage alone can be misleading. A node may report XX% (below 100%) CPU utilization while certain tasks are experiencing severe latency due to scheduling delays. PSI fills this gap by providing:
- Cumulative Totals: Absolute time spent in a stalled state.
- Moving Averages: 10s, 60s, and 300s windows that allow operators to distinguish between transient spikes and sustained resource tension.
Proving stability: performance testing at scale
A common concern when graduating telemetry features is the resource overhead required to collect and serve the metrics. To address this, SIG Node conducted extensive performance validation on high-density workloads (80+ pods) across various machine types.
Our testing focused on two primary scenarios to isolate the impact of the Kubelet and kernel-level collection respectively:
- Kernel PSI ON / Kubelet Feature OFF vs Kernel PSI ON / Kubelet Feature ON (Kubelet overhead)
- Kernel PSI OFF / Kubelet Feature ON vs Kernel PSI ON / Kubelet Feature ON (Kernel overhead)
Scenario 1: The Kubelet Overhead
First, we looked at the kubelet usage on 4 core machines (Case 1). For these, the Linux kernel was already tracking pressure on both clusters by default(psi=1), but we toggled the KubeletPSI feature gate to see if the Kubelet actively querying and exposing these metrics impacted the resource usage. The synchronized bursts seen in the graph are practically identical in both magnitude and frequency, confirming that the Kubelet's collection logic is highly lightweight and blends seamlessly into standard housekeeping cycles. There is no issue about the feature affecting the pre-existing resource use, staying within the normal 0.1 cores or 2.5% of the total node capacity, and is therefore safe for production-scale deployments.
(Case 1) Kubelet CPU Usage Rate Comparison
Figure 2: Kubelet CPU Usage Rate Comparison.
Next, we evaluated the system overhead in the same run. As seen in the following graph, the System CPU usage lines for the Kubelet PSI-enabled (red) follows the same pattern as the Kubelet PSI-disabled (blue) clusters, with a slight expected increase from the baseline. This visualizes that once the OS is tracking PSI, at around 2.5 cores, the act of Kubernetes reading those cgroup metrics is negligible to performance.
(Case 1) System CPU Usage Rate Comparison
Figure 1: Node System CPU Usage Rate Comparison.
Scenario 2: The Kernel Overhead
Shifting gears, we evaluated the underlying overhead of enabling PSI on the Linux kernel also on a 4 core machine. By comparing a cluster booted with psi=1 (COS default) against a cluster with psi=0, we isolated the exact cost of the OS-level bookkeeping. Even under heavy I/O and CPU load at an 80-pod density, the System CPU delta between the kernel-enabled and kernel-disabled clusters remained consistently between 0.037 cores and 0.125 cores or 0.925% - 3.125% of the total node capacity. There was a single spike to 0.225 cores, or 5.6%, but was controlled back down within a few seconds. This confirms that the internal kernel tracking is highly efficient under load.
(Case 2) Node System CPU Usage Rate Comparison
Figure 3: Node System CPU Usage Rate Comparison.
Figure 4 zooms in on the kubelet process itself, which serves as the primary collector for these metrics. . The results show that even while the kubelet performs periodic sweeps to aggregate data from the cgroup hierarchy, its CPU usage remains remarkably low with interchangeable spikes and nothing exceeding 0.25 cores or 6.25% of total capacity for longer than a second.
(Case 2) Kubelet CPU Usage Rate Comparison
Figure 4: Kubelet CPU Usage Rate Comparison.
Improvements between beta (1.34) and stable (1.36)
- Smarter Metric Emission for GA: We improved how the Kubelet handles underlying OS support for PSI. Previously, if the feature was enabled in Kubernetes but the underlying Linux kernel didn't support PSI (
psi=0), the Kubelet would emit misleading zero-valued metrics. These could trigger false alarms when read as real metrics instead of missing values. In v1.36, the Kubelet now detects OS-level PSI support via cgroup configurations before reporting. This ensures that pressure metrics are only collected and emitted when they are actually supported by the node, providing cleaner data for monitoring and alerting systems.
Getting started
To use PSI metrics in your Kubernetes cluster, your nodes must meet the following requirements:
- Ensure your nodes are running a Linux kernel version 4.20 or later and are using cgroup v2.
- Ensure PSI is enabled at the OS level (your kernel must be compiled with
CONFIG_PSI=yand must not be booted with thepsi=0parameter).
As of v1.36, Kubelet PSI metrics are generally available and you do not need to opt in to any feature gate.
Once the OS prerequisites are met, you can start scraping the /metrics/cadvisor endpoint with your Prometheus-compatible monitoring solution or query the Summary API to collect and visualize the new PSI metrics. Note that PSI is a Linux-kernel feature, so these metrics are not available on Windows nodes. Your cluster can contain a mix of Linux and Windows nodes, and on the Windows nodes, the kubelet will simply omit the PSI metrics.
If your cluster is running a recent enough version of Kubernetes and you are a privileged node administrator, you can also proxy to the kubelet's HTTP API via the control plane's API server to see real-time pressure data from the Summary API.
Caution: Proxying to the kubelet is a privileged operation. Granting access to it is a security risk, so ensure you have the appropriate administrative permissions before executing these commands.
CONTAINER_NAME="example-container"
kubectl get --raw "/api/v1/nodes/$(kubectl get nodes -o jsonpath='{.items[0].metadata.name}')/proxy/stats/summary" | jq '.pods[].containers[] | select(.name=="'"$CONTAINER_NAME"'") | {name, cpu: .cpu.psi, memory: .memory.psi, io: .io.psi}'
Further reading
If you want to dive deeper into how these metrics are calculated and exposed, check out these resources:
- The official Kernel documentation
- Understanding PSI in the Kubernetes documentation
- cAdvisor Metrics Implementation
Acknowledgements
Support for PSI metrics was developed through the collaborative efforts of SIG Node. Special thanks to all contributors who helped design, implement, test, review, and document this feature across its journey from alpha in v1.33, through beta in v1.34, to GA in v1.36.
To provide feedback on this feature, join the Kubernetes Node Special Interest Group, participate in discussions on the public Slack channel (#sig-node), or file an issue on GitHub.
Feedback
If you have feedback and want to share your experience using this feature, join the discussion:
- SIG Node community page
- Kubernetes Slack in the #sig-node channel
- SIG Node mailing list
SIG Node would love to hear about your experiences using this feature in production!
Copy.Fail Linux Vulnerability
This is the worst Linux vulnerability in years.
TL;DR
- copy.fail is a Linux kernel local privilege escalation, not a browser or clipboard attack. Disclosed by Theori on 29 April 2026 with a working PoC.
- It abuses the kernel crypto API (AF_ALG sockets) plus splice() to write four bytes at a time straight into the page cache of a file the attacker does not own.
- The exploit works unmodified across Ubuntu, RHEL, Debian, SUSE, Amazon Linux, Fedora and most others. No race condition, no per-distro offsets.
- The file on disk is never modified. AIDE, Tripwire and checksum-based monitoring see nothing. ...
A decade of governance: Cloud Custodian at 10 and its role in the agentic AI era
What is Cloud Custodian? It is an open source, stateless policy engine used to manage public cloud environments, Kubernetes and infrastructure as code through a unified DSL. As an incubating project within CNCF, it allows organizations to define and enforce policies for FinOps, security, and compliance across multiple providers.
Why the 10th anniversary of Cloud Custodian matters now
Reaching a 10-year milestone is significant because Cloud Custodian has transitioned from a cloud management tool into a fundamental cost optimization and safety layer for the AI era. With the rise of agentic AI, where autonomous agents generate and deploy infrastructure code, real-time automated governance has become a necessity. Beyond agentic code, AI workloads like GPU fleets, model serving endpoints, and training pipelines introduce both a larger security attack surface and significantly higher cost exposure, where the risk of ungoverned resources is higher than ever.
Why Cloud Custodian is essential for AI governance
- Automated Guardrails: Cloud Custodian provides the structured, programmable boundaries required when AI agents manage infrastructure. and when high-cost AI workloads like GPU fleets and model serving endpoints are provisioned.
- Real-time enforcement: It closes cost and security risk windows by enforcing organizational and industry best practices as soon as AI-generated resources are deployed.
- Vendor neutrality: The project ensures consistent governance across AWS, Azure, GCP, Oracle Cloud, Kubernetes and Terraform preventing fragmented cost or security postures in complex AI workflows.
Reaching ten years is a testament to the community of maintainers and contributors who have built Cloud Custodian into a foundational tool for cloud governance as code. As we move into an era of AI-driven automation, the project’s ability to provide transparent, programmable guardrails ensures that even when code is generated by a machine, it adheres to human-defined standards of safety and efficiency.
How Cloud Custodian empowers the cloud native ecosystem
Cloud Custodian aligns with CNCF principles by focusing on declarative automation and community-led innovation.
- Declarative policy: Users describe the desired state of their cloud resources, and the engine handles enforcement.
- Action and remediation: Beyond detection, Cloud Custodian is built to fix and prevent issues through customizable remediation workflows — critical at the speed and complexity of AI-scale environments.
- Scalability: Designed for high-velocity environments, it manages thousands of resources without the overhead of stateful management.
- Proven reliability: A decade of production use has resulted in a robust library of thousands of community-vetted policy actions and filters.
Frequently asked questions about Cloud Custodian
How does Cloud Custodian help with cost management?
It uses policies to reduce waste by eliminating idle or underprovisioned resources, including idle training jobs and GPU fleets. It also prevents costly misconfigurations such as oversized storage tiers, ensuring cloud environments stay efficient and well-governed.
Is Cloud Custodian compatible with multiple clouds?
Yes, it provides a unified DSL to manage resources across AWS, Azure, GCP, and OCI , ensuring a single source of truth for organizational policy.
Why is Cloud Custodian relevant for AI-generated code?
AI agents can ship code faster than humans can review it. Cloud Custodian acts as an automated safety net, ensuring all machine-deployed infrastructure follows security and compliance rules while catching costly misconfigurations before they become security gaps or budget overruns.
Next steps for the community
To celebrate this milestone and explore how Cloud Custodian is adapting to the latest industry shifts, we encourage the community to engage with the following resources:
- Read the full announcement: An Open Source Project Turns 10 and Finds Itself Tailor-Made for the Agentic AI Era
- View the documentation: Visit cloudcustodian.io for technical guides.
- Contribute: Join the maintainers and contributors at the Cloud Custodian GitHub repository.
Congratulations to the contributors who have made the last decade possible. Here is to ten years of governance and the road ahead.
The path to zero trust: Bridging the gap between AI development and OpSec
LLMs and Text-in-Text Steganography
Turns out that LLMs are really good at hiding text messages in other text messages.
Why iGaming Infrastructure is Breaking and What Comes Next
Friday Squid Blogging: Giant Squid Live in the Waters of Western Australia
Evidence of them has been found by analyzing DNA in the seawater.
As usual, you can also use this squid post to talk about the security stories in the news that I haven’t covered.
Kubernetes v1.36: Moving Volume Group Snapshots to GA
Volume group snapshots were introduced as an Alpha feature with the Kubernetes v1.27 release, moved to Beta in v1.32, and to a second Beta in v1.34. We are excited to announce that in the Kubernetes v1.36 release, support for volume group snapshots has reached General Availability (GA).
The support for volume group snapshots relies on a set of extension APIs for group snapshots. These APIs allow users to take crash-consistent snapshots for a set of volumes. Behind the scenes, Kubernetes uses a label selector to group multiple PersistentVolumeClaim objects for snapshotting. A key aim is to allow you to restore that set of snapshots to new volumes and recover your workload based on a crash-consistent recovery point.
This feature is only supported for CSI volume drivers.
An overview of volume group snapshots
Some storage systems provide the ability to create a crash-consistent snapshot of multiple volumes. A group snapshot represents copies made from multiple volumes that are taken at the same point-in-time. A group snapshot can be used either to rehydrate new volumes (pre-populated with the snapshot data) or to restore existing volumes to a previous state (represented by the snapshots).
Why add volume group snapshots to Kubernetes?
The Kubernetes volume plugin system already provides a powerful abstraction that automates the provisioning, attaching, mounting, resizing, and snapshotting of block and file storage. Underpinning all these features is the Kubernetes goal of workload portability.
There was already a VolumeSnapshot API that provides the ability to take a snapshot of a persistent volume to protect against data loss or data corruption. However, some storage systems support consistent group snapshots that allow a snapshot to be taken from multiple volumes at the same point-in-time to achieve write order consistency. This is extremely useful for applications that contain multiple volumes. For example, an application may have data stored in one volume and logs stored in another. If snapshots for these volumes are taken at different times, the application will not be consistent and will not function properly if restored from those snapshots.
While you can quiesce the application first and take individual snapshots sequentially, this process can be time-consuming or sometimes impossible. Consistent group support provides crash consistency across all volumes in the group without the need for application quiescence.
Kubernetes APIs for volume group snapshots
Kubernetes' support for volume group snapshots relies on three API kinds that are used for managing snapshots:
- VolumeGroupSnapshot
- Created by a Kubernetes user (or automation) to request creation of a volume group snapshot for multiple persistent volume claims.
- VolumeGroupSnapshotContent
- Created by the snapshot controller for a dynamically created VolumeGroupSnapshot. It contains information about the provisioned cluster resource (a group snapshot). The object binds to the VolumeGroupSnapshot for which it was created with a one-to-one mapping.
- VolumeGroupSnapshotClass
- Created by cluster administrators to describe how volume group snapshots should be created, including the driver information, the deletion policy, etc.
These three API kinds are defined as CustomResourceDefinitions (CRDs). For the GA release, the API version has been promoted to v1.
What's new in GA?
- The API version for
VolumeGroupSnapshot,VolumeGroupSnapshotContent, andVolumeGroupSnapshotClassis promoted togroupsnapshot.storage.k8s.io/v1. - Enhanced stability and bug fixes based on feedback from the beta releases, including the improvements introduced in v1beta2 for accurate
restoreSizereporting.
How do I use Kubernetes volume group snapshots
Creating a new group snapshot with Kubernetes
Once a VolumeGroupSnapshotClass object is defined and you have volumes you want to snapshot together, you may request a new group snapshot by creating a VolumeGroupSnapshot object.
Label the PVCs you wish to group:
% kubectl label pvc pvc-0 group=myGroup
persistentvolumeclaim/pvc-0 labeled

% kubectl label pvc pvc-1 group=myGroup
persistentvolumeclaim/pvc-1 labeled
For dynamic provisioning, a selector must be set so that the snapshot controller can find PVCs with the matching labels to be snapshotted together.
apiVersion: groupsnapshot.storage.k8s.io/v1
kind: VolumeGroupSnapshot
metadata:
 name: snapshot-daily-20260422
 namespace: demo-namespace
spec:
 volumeGroupSnapshotClassName: csi-groupSnapclass
 source:
 selector:
 matchLabels:
 group: myGroup
The VolumeGroupSnapshotClass is required for dynamic provisioning:
apiVersion: groupsnapshot.storage.k8s.io/v1
kind: VolumeGroupSnapshotClass
metadata:
 name: csi-groupSnapclass
driver: example.csi.k8s.io
deletionPolicy: Delete
How to use group snapshot for restore
At restore time, request a new PersistentVolumeClaim to be created from a VolumeSnapshot object that is part of a VolumeGroupSnapshot. Repeat this for all volumes that are part of the group snapshot.
apiVersion: v1
kind: PersistentVolumeClaim
metadata:
 name: examplepvc-restored-2026-04-22
 namespace: demo-namespace
spec:
 storageClassName: example-sc
 dataSource:
 name: snapshot-0962a745b2bf930bb385b7b50c9b08af471f1a16780726de19429dd9c94eaca0
 kind: VolumeSnapshot
 apiGroup: snapshot.storage.k8s.io
 accessModes:
 - ReadWriteOncePod
 resources:
 requests:
 storage: 100Mi
As a storage vendor, how do I add support for group snapshots?
To implement the volume group snapshot feature, a CSI driver must:
- Implement a new group controller service.
- Implement group controller RPCs:
CreateVolumeGroupSnapshot,DeleteVolumeGroupSnapshot, andGetVolumeGroupSnapshot. - Add group controller capability
CREATE_DELETE_GET_VOLUME_GROUP_SNAPSHOT.
See the CSI spec and the Kubernetes-CSI Driver Developer Guide for more details.
How can I learn more?
- The design spec for the volume group snapshot feature.
- The code repository for volume group snapshot APIs and controller.
- CSI documentation on the group snapshot feature.
How do I get involved?
This project, like all of Kubernetes, is the result of hard work by many contributors from diverse backgrounds working together. On behalf of SIG Storage, I would like to offer a huge thank you to all the contributors who stepped up over the years to help the project reach GA:
- Ben Swartzlander (bswartz)
- Cici Huang (cici37)
- Darshan Murthy (darshansreenivas)
- Hemant Kumar (gnufied)
- James Defelice (jdef)
- Jan Šafránek (jsafrane)
- Madhu Rajanna (Madhu-1)
- Manish M Yathnalli (manishym)
- Michelle Au (msau42)
- Niels de Vos (nixpanic)
- Leonardo Cecchi (leonardoce)
- Rakshith R (Rakshith-R)
- Raunak Shah (RaunakShah)
- Saad Ali (saad-ali)
- Wei Duan (duanwei33)
- Xing Yang (xing-yang)
- Yati Padia (yati1998)
For those interested in getting involved with the design and development of CSI or any part of the Kubernetes Storage system, join the Kubernetes Storage Special Interest Group (SIG). We always welcome new contributors.
We also hold regular Data Protection Working Group meetings. New attendees are welcome to join our discussions.
Insider Betting on Polymarket
Insider trading is rife on Polymarket:
Analysis by the Anti-Corruption Data Collective, a non-profit research and advocacy group, found that long-shot bets—defined as wagers of $2,500 or more at odds of 35 percent or less—on the platform had an average win rate of around 52 percent in markets on military and defense actions.
That compares with a win rate of 25 percent across all politics-focused markets and just 14 percent for all markets on the platform as a whole.
It is absolutely insane that this is legal. We already know how insider betting warps sports. Insider betting warping politics—and military actions—is orders of magnitude worse...
Canvas Breach Disrupts Schools & Colleges Nationwide
An ongoing data extortion attack targeting the widely-used education technology platform Canvas disrupted classes and coursework at school districts and universities across the United States today, after a cybercrime group defaced the service’s login page with a ransom demand that threatened to leak data from 275 million students and faculty across nearly 9,000 educational institutions.
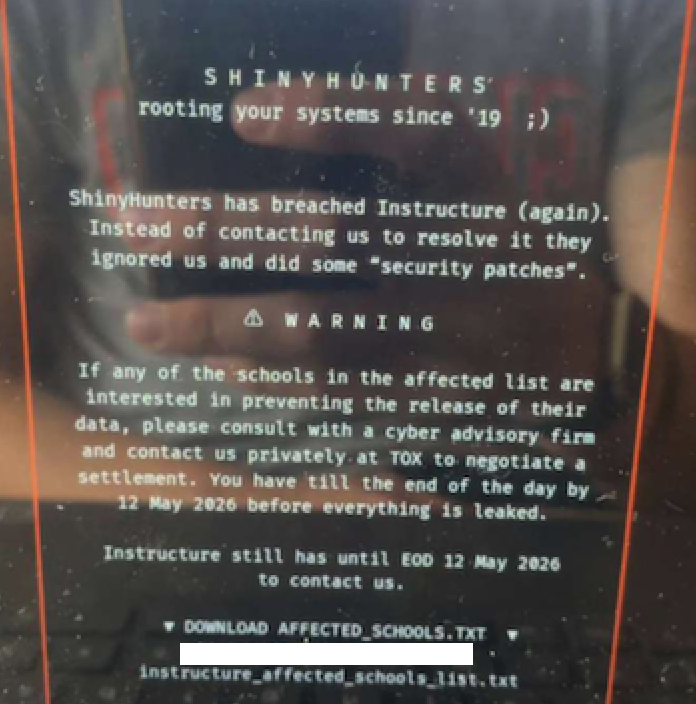
A screenshot shared by a reader showing the extortion message that was shown on the Canvas login page today.
Canvas parent firm Instructure responded to today’s defacement attacks by disabling the platform, which is used by thousands of schools, universities and businesses to manage coursework and assignments, and to communicate with students.
Instructure acknowledged a data breach earlier this week, after the cybercrime group ShinyHunters claimed responsibility and said they would leak data on tens of millions of students and faculty unless paid a ransom. The stated deadline for payment was initially set at May 6, but it was later pushed back to May 12.
In a statement on May 6, Instructure said the investigation so far shows the stolen information includes “certain identifying information of users at affected institutions, such as names, email addresses, and student ID numbers, as well as as messages among users.” The company said it found no evidence the breached data included more sensitive information, such as passwords, dates of birth, government identifiers or financial information.
The May 6 update stated that Canvas was fully operational, and that Instructure was not seeing any ongoing unauthorized activity on their platform. “At this stage, we believe the incident has been contained,” Instructure wrote.
However, by mid-day on Thursday, May 7, students and faculty at dozens of schools and universities were flooding social media sites with comments saying that a ransom demand from ShinyHunters had replaced the usual Canvas login page. Instructure responded by pulling Canvas offline and replacing the portal with the message, “Canvas is currently undergoing scheduled maintenance. Check back soon.”
“We anticipate being up soon, and will provide updates as soon as possible,” reads the current message on Instructure’s status page.
While the data stolen by ShinyHunters may or may not contain particularly sensitive information (ShinyHunters claims it includes several billion private messages among students and teachers, as well as names, phone numbers and email addresses), this attack could hardly have come at a worse time for Instructure: Many of the affected schools and universities are in the middle of final exams, and a prolonged outage could be highly damaging for the company.
The extortion message that greeted countless Canvas users today advised the affected schools to negotiate their own ransom payments to prevent the publication of their data — regardless of whether Instructure decides to pay.
“ShinyHunters has breached Instructure (again),” the extortion message read. “Instead of contacting us to resolve it they ignored us and did some ‘security patches.'”
A source close to the investigation who was not authorized to speak to the press told KrebsOnSecurity that a number of universities have already approached the cybercrime group about paying. The same source also pointed out that the ShinyHunters data leak blog no longer lists Instructure among its current extortion victims, and that the samples of data stolen from Canvas customers were removed as well. Data extortion groups like ShinyHunters will typically only remove victims from their leak sites after receiving an extortion payment or after a victim agrees to negotiate.
Dipan Mann, founder and CEO of the security firm Cloudskope, slammed Instructure for referring to today’s outage as a “scheduled maintenance” event on its status page. Mann said Shiny Hunters first demonstrated they’d breached Instructure on May 1, prompting Instructure’s Chief Information Security Officer Steve Proud to declare the following day that the incident had been contained. But Mann said today’s attack is at least the third time in the past eight months that Instructure has been breached by ShinyHunters.
In a blog post today, Mann noted that in September 2025, ShinyHunters released thousands of internal University of Pennsylvania files — donor records, internal memos, and other confidential materials — through what the Daily Pennsylvanian and other outlets later determined was, in part, a Canvas/Instructure-mediated access path.
“Penn was the named victim,” Mann wrote. “Instructure was the mechanism. The incident was treated as a Penn-specific story by most of the national press and quietly handled by Instructure as a customer-specific matter. That framing was wrong then. It is dramatically more wrong in light of the May 2026 events, which now look like the planned escalation of an attack pattern that ShinyHunters had been working against Instructure’s environment for at least eight months prior. The September 2025 Penn breach was the proof of concept. The May 1, 2026 incident was the production run. The May 7, 2026 recompromise was ShinyHunters demonstrating publicly that the May 2 ‘containment’ did not happen.”
In February, a ShinyHunters spokesperson told The Daily Pennsylvanian that Penn failed to pay a $1 million ransom demand. On March 5, ShinyHunters published 461 megabytes worth of data stolen from Penn, including thousands of files such as donor records and internal memos.
ShinyHunters is a prolific and fluid cybercriminal group that specializes in data theft and extortion. They typically gain access to companies through voice phishing and social engineering attacks that often involve impersonating IT personnel or other trusted members of a targeted organization.
Last month, ShinyHunters relieved the home security giant ADT of personal information on 5.5 million customers. The extortion group told BleepingComputer they breached the company by compromising an employee’s Okta single sign-on account in a voice phishing attack that enabled access to ADT’s Salesforce instance. BleepingComputer says ShinyHunters recently has taken credit for a number of extortion attacks against high-profile organizations, including Medtronic, Rockstar Games, McGraw Hill, 7-Eleven and the cruise line operator Carnival.
The attack on Canvas customers is just one of several major cybercrime campaigns being launched by ShinyHunters at the moment, said Charles Carmakal, chief technology officer at the Google-owned Mandiant Consulting. Carmakal declined to comment specifically on the Canvas breach, but said “there are multiple concurrent and discrete ShinyHunters intrusion and extortion campaigns happening right now.”
Cloudskope’s Mann said what happens next depends largely on whether Instructure’s customers — the universities, K-12 districts, and education ministries paying for Canvas — choose to apply pressure or absorb the breach quietly.
“The history of education-vendor incidents suggests the path of least resistance is the second one,” he concluded.
Update, May 8, 11:05 a.m. ET: Instructure has published an incident update page that includes more information about the breach. Instructure said its Canvas portal is functioning normally again, and that the hackers exploited an issue related to Free-for-Teacher accounts.
“This is the same issue that led to the unauthorized access the prior week,” Instructure wrote. “As a result, we have made the difficult decision to temporarily shut down Free-for-Teacher accounts. These accounts have been a core part of our platform, and we’re committed to resolving the issues with these accounts.”
Instructure said affected organizations were notified on May 6.
“If your organization is affected, Instructure will contact your organization’s primary contacts directly,” the update states. “Please don’t rely on third-party lists or social media posts naming potentially affected organizations as those lists aren’t verified. Instructure will confirm validated information through direct outreach to all affected organizations.”
Kubernetes v1.36: More Drivers, New Features, and the Next Era of DRA
Dynamic Resource Allocation (DRA) has fundamentally changed how platform administrators handle hardware accelerators and specialized resources in Kubernetes. In the v1.36 release, DRA continues to mature, bringing a wave of feature graduations, critical usability improvements, and new capabilities that extend the flexibility of DRA to native resources like memory and CPU, and support for ResourceClaims in PodGroups.
Driver availability continues to expand. Beyond specialized compute accelerators, the ecosystem includes support for networking and other hardware types, reflecting a move toward a more robust, hardware-agnostic infrastructure.
Whether you are managing massive fleets of GPUs, need better handling of failures, or simply looking for better ways to define resource fallback options, the upgrades to DRA in 1.36 have something for you. Let's dive into the new features and graduations!
Feature graduations
The community has been hard at work stabilizing core DRA concepts. In Kubernetes 1.36, several highly anticipated features have graduated to Beta and Stable.
Prioritized list (stable)
Hardware heterogeneity is a reality in most clusters. With the Prioritized list feature, you can confidently define fallback preferences when requesting devices. Instead of hardcoding a request for a specific device model, you can specify an ordered list of preferences (e.g., "Give me an H100, but if none are available, fall back to an A100"). The scheduler will evaluate these requests in order, drastically improving scheduling flexibility and cluster utilization.
Extended resource support (beta)
As DRA becomes the standard for resource allocation, bridging the gap with legacy systems is crucial. The DRA Extended resource feature allows users to request resources via traditional extended resources on a Pod. This allows for a gradual transition to DRA, meaning cluster operators can migrate clusters to DRA but let application developers adopt the ResourceClaim API on their own schedule.
Partitionable devices (beta)
Hardware accelerators are powerful, and sometimes a single workload doesn't need an entire device. The Partitionable devices feature, provides native DRA support for dynamically carving physical hardware into smaller, logical instances (such as Multi-Instance GPUs) based on workload demands. This allows administrators to safely and efficiently share expensive accelerators across multiple Pods.
Device taints (beta)
Just as you can taint a Kubernetes Node, you can apply taints directly to specific DRA devices. Device taints and tolerations empower cluster administrators to manage hardware more effectively. You can taint faulty devices to prevent them from being allocated to standard claims, or reserve specific hardware for dedicated teams, specialized workloads, and experiments. Ultimately, only Pods with matching tolerations are permitted to claim these tainted devices.
Device binding conditions (beta)
To improve scheduling reliability, the Kubernetes scheduler can use the Binding conditions feature to delay committing a Pod to a Node until its required external resources—such as attachable devices or FPGAs—are fully prepared. By explicitly modeling resource readiness, this prevents premature assignments that can lead to Pod failures, ensuring a much more robust and predictable deployment process.
Resource health status (beta)
Knowing when a device has failed or become unhealthy is critical for workloads running on specialized hardware. With Resource health status, Kubernetes expose device health information directly in the Pod status, giving users and controllers crucial visibility to quickly identify and react to hardware failures. The feature includes support for human-readable health status messages, making it significantly easier to diagnose issues without the need to dive into complex driver logs.
New Features
Beyond stabilizing existing capabilities, v1.36 introduces foundational new features that expand what DRA can do. These are alpha features, so they are behind feature gates that are disabled by default.
ResourceClaim support for workloads
To optimize large-scale AI/ML workloads that rely on strict topological scheduling, the ResourceClaim support for workloads feature enables Kubernetes to seamlessly manage shared resources across massive sets of Pods. By associating ResourceClaims or ResourceClaimTemplates with PodGroups, this feature eliminates previous scaling bottlenecks, such as the limit on the number of pods that can share a claim, and removes the burden of manual claim management from specialized orchestrators.
Node allocatable resources
Why should DRA only be for external accelerators? In v1.36, we are introducing the first iteration of using the DRA APIs to manage node allocatable infrastructure resources (like CPU and memory). By bringing CPU and memory allocation under the DRA umbrella with the DRA Node allocatable resources feature, users can leverage DRA's advanced placement, NUMA-awareness, and prioritization semantics for standard compute resources, paving the way for incredibly fine-grained performance tuning.
DRA resource availability visibility
One of the most requested features from cluster administrators has been better visibility
into hardware capacity. The new
Resource pool status
feature allows you to query the availability of devices in DRA resource pools. By creating a
ResourcePoolStatusRequest object, you get a point-in-time snapshot of device counts
— total, allocated, available, and unavailable — for each pool managed by a given
driver. This enables better integration with dashboards and capacity planning tools.
List types for attributes
ResourceClaim constraint evaluation has changed to work better with scalar
and list values:
matchAttribute now checks for a non-empty intersection, and
distinctAttribute checks for pairwise disjoint values.
An includes() function in CEL has also been introduced,
that lets device selectors keep working more easily when an attribute
changes between scalar and list representations.
(The includes() function is only available in DRA
contexts for expression evaluation).
Deterministic device selection
The Kubernetes scheduler has been updated to evaluate devices using lexicographical ordering based on resource pool and ResourceSlice names. This change empowers drivers to proactively influence the scheduling process, leading to improved throughput and more optimal scheduling decisions. The ResourceSlice controller toolkit automatically generates names that reflect the exact device ordering specified by the driver author.
Discoverable device metadata in containers
Workloads running on nodes with DRA devices often need to discover details about their allocated devices, such as PCI bus addresses or network interface configuration, without querying the Kubernetes API. With Device metadata, Kubernetes defines a standard protocol for how DRA drivers expose device attributes to containers as versioned JSON files at well-known paths. Drivers built with the DRA kubelet plugin library get this behavior transparently; they just provide the metadata and the library handles file layout, CDI bind-mounts, versioning, and lifecycle. This gives applications a consistent, driver-independent way to discover and consume device metadata, eliminating the need for custom controllers or looking up ResourceSlice objects to get metadata via attributes.
What’s next?
This release introduced a wealth of new Dynamic Resource Allocation (DRA) features, and the momentum is only building. As we look ahead, our roadmap focuses on maturing existing features toward beta and stable releases while hardening DRA’s performance, scalability, and reliability. A key priority over the coming cycles will be deep integration with workload aware and topology aware scheduling.
A big goal for us is to migrate users from Device Plugin to DRA, and we want you involved. Whether you are currently maintaining a driver or are just beginning to explore the possibilities, your input is vital. Partner with us to shape the next generation of resource management. Reach out today to collaborate on development, share feedback, or start building your first DRA driver.
Getting involved
A good starting point is joining the WG Device Management Slack channel and meetings, which happen at Americas/EMEA and EMEA/APAC friendly time slots.
Not all enhancement ideas are tracked as issues yet, so come talk to us if you want to help or have some ideas yourself! We have work to do at all levels, from difficult core changes to usability enhancements in kubectl, which could be picked up by newcomers.
Smart Glasses for the Authorities
ICE is developing its own version of smart glasses, with facial recognition tied to various databases.