CNCF Projects
Inspektor Gadget: Results from the first security audit
Inspektor Gadget, the open source eBPF-based toolkit for Kubernetes observability and Linux host inspection, has completed its first independent security audit. The audit was coordinated by the Open Source Technology Improvement Fund (OSTIF), funded by the CNCF and carried out by Shielder. The findings, the fixes, and the hardening recommendations are now public, and every reported vulnerability has a patch available.
This post walks through what Inspektor Gadget does, how the audit was scoped, what the researchers found, and what the results mean for teams running it in production.
What is Inspektor Gadget?
Inspektor Gadget is a framework and toolkit that uses eBPF to collect and inspect data on Kubernetes clusters and Linux hosts. It manages the packaging, deployment, and execution of “gadgets” — eBPF programs packaged as OCI images. OCI (the Open Container Initiative) is a Linux Foundation project that defines open industry standards for container image formats and runtimes, so the same image can be distributed and run across any compliant tool or registry.
For teams running Kubernetes in production that need to understand what is happening inside a cluster, Inspektor Gadget provides that visibility without the usual tradeoffs. There is no need to rebuild container images with extra instrumentation, inject sidecars into every pod, attach debuggers or strace to running processes, restart workloads to toggle tracing on and off, or ship custom kernel modules to nodes. Instead, eBPF programs are loaded into the kernel at runtime to safely observe syscalls, network activity, and file access. Applications keep running unchanged while operators get the data they need.
Why a security audit?
Any tool that runs with elevated privileges on shared infrastructure needs to earn trust. Inspektor Gadget runs with root-level access on nodes to do its job, so an independent review of its security posture is a natural step as the project matures and adoption grows.
OSTIF is a nonprofit dedicated to improving the security of open source software. Over the past ten years, OSTIF has managed security engagements that have uncovered more than 800 vulnerabilities across 120 open source projects.
How the audit was scoped
OSTIF engaged Shielder (add link), to perform the assessment. Two researchers worked on the audit in early 2026. Their methodology combined:
- Collaborative threat modeling with the Inspektor Gadget maintainers
- Manual source code review
- Dynamic testing on dedicated lab environments
- Static analysis using tools such as Semgrep and GoSec
- AI-assisted code review for broader coverage
The researchers built three test environments that reflect how Inspektor Gadget is deployed in the wild: a local Linux host deployment, a remote daemon deployment, and a Kubernetes deployment on minikube.
What the audit found
The audit identified three vulnerabilities. None were rated Critical or High severity.
Two Medium severity findings
- Command injection in ig image build (CVE-2026-24905). The image build process used Makefiles that embedded user-controlled input without proper escaping, creating a command injection vector. This matters most in CI/CD pipelines that build untrusted gadgets. Fixed in release v0.48.1.
- Denial of service via event flooding. A malicious container could flood the eBPF ring buffer (hard-coded to 256 KB), causing the system to silently drop events from other containers. For teams using Inspektor Gadget as part of a security monitoring pipeline, this could allow an attacker to hide activity by generating noise. Fixed in release v0.50.1.
One Low severity finding
- Unsanitized ANSI escape sequences in columns output mode (CVE-2026-25996). When rendering events in the terminal, Inspektor Gadget did not sanitize ANSI escape sequences, allowing a compromised container to inject terminal escape codes into an operator’s display. Fixed in release v0.49.1.
Hardening recommendations
Beyond the specific vulnerabilities, Shielder delivered six hardening recommendations. These are not active exploits — they are areas where the project can reduce its attack surface over time:
- Enforce TLS by default on TCP listeners. When the daemon starts a TCP listener without TLS, it currently logs a warning and continues in plaintext. The recommendation is to require an explicit opt-out flag.
- Pin and verify external dependencies in CI/CD. Several build dependencies were downloaded without hash or signature verification. The project has already landed fixes or has pull requests open for most of these.
- Implement a Kubernetes namespace blocklist to prevent unintended tracing on sensitive namespaces such as kube-system.
- Restrict remote clients from enabling host-level tracing through the daemon, or clearly document the risk.
- Automate third-party vulnerability scanning for project dependencies.
- Reduce RBAC permissions on the DaemonSet pod — specifically the nodes/proxy GET permission, which could be leveraged for privilege escalation if the service account token is compromised.
The maintainers are working through these systematically. Some are already merged; others, notably the RBAC refactor and namespace blocklist, will take more time.
Gadget bypass testing
One of the most technically interesting parts of the audit was the gadget bypass testing. The researchers asked: can a compromised container perform operations that a gadget is meant to trace, without triggering any events? They identified six bypass scenarios, ranging from using newer Linux syscalls that certain gadgets don’t hook (for example, openat2 instead of openat) to evasion through io_uring and statically linked libraries.
These results reflect the cat-and-mouse nature of kernel-level tracing. Linux keeps evolving, new syscalls and subsystems keep appearing, and eBPF-based tracing tools have to keep up. The Inspektor Gadget maintainers have already addressed several of the identified gaps and are documenting the inherent limitations of the approach so operators understand what eBPF tracing can and cannot guarantee.
What this means for users
The actionable step for organizations running Inspektor Gadget is to update to v0.50.1 or later, which includes fixes for all three reported vulnerabilities. Shielder’s own conclusion, from the final report, is that “the overall security posture of Inspektor Gadget is adequately mature from both a secure coding and design point of view.”
For the wider cloud native community, this audit is an example of how the ecosystem is supposed to work. A project reaches a level of adoption where independent security review becomes necessary, OSTIF coordinates a qualified engagement, researchers do the work in the open, maintainers land the fixes, and the full report is published so users can make informed decisions.
Resources
- Inspektor Gadget on GitHub
- Inspektor Gadget release v0.50.1
- OSTIF (Open Source Technology Improvement Fund)
- Shielder
Audit announcement and resources
- Full Report – Downloadable PDF
- Blog post – Inspektor Gadget
- Blog post – OSTIF
- Blog post – Shielder
- Blog post – Microsoft
CVEs
From Kubernetes Dashboard to Headlamp: Understanding the Transition
For many people, Kubernetes Dashboard was their first window into Kubernetes. It offered a simple visual way to see what was running in a cluster, inspect resources, and build confidence without relying on the command line. For years, it helped developers, students, and operators make sense of Kubernetes, and it served as an important onramp into the ecosystem.
The Kubernetes Dashboard project has now been archived. We deeply respect the work the team did and the role Dashboard played in making Kubernetes more approachable for so many users.
Headlamp builds on that foundation and carries it forward. It keeps the clarity of a visual interface while adding capabilities that match how Kubernetes is used today. This includes multi-cluster visibility, application-centric views, extensibility through plugins, and flexible deployment options that work both in-cluster and on the desktop.
This guide is meant to help you navigate that transition with confidence. Before diving into the mechanics of migration, we start with familiar ground by looking at how common Kubernetes Dashboard workflows map to Headlamp. We also cover what stays the same and what improves after the switch. The goal is not just to replace a tool, but to honor a user-centered legacy and help you land in a UI that can grow with you as your Kubernetes usage evolves.
Mapping Kubernetes Dashboard workloads to Headlamp
If you have used Kubernetes Dashboard before, many workflows in Headlamp will feel familiar. Headlamp does not introduce a new way of thinking. Instead, it builds on workloads users already know and extends them in practical ways. The focus is continuity. What worked before still works, with more room to grow.
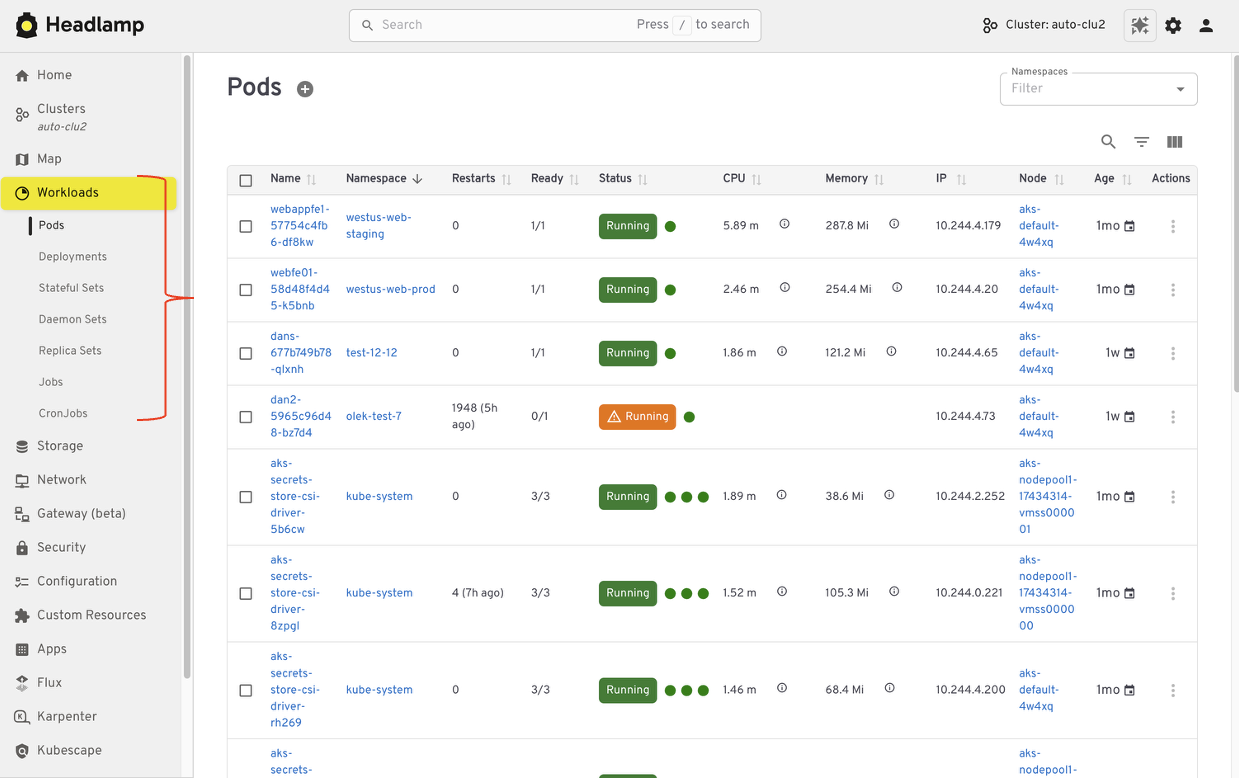
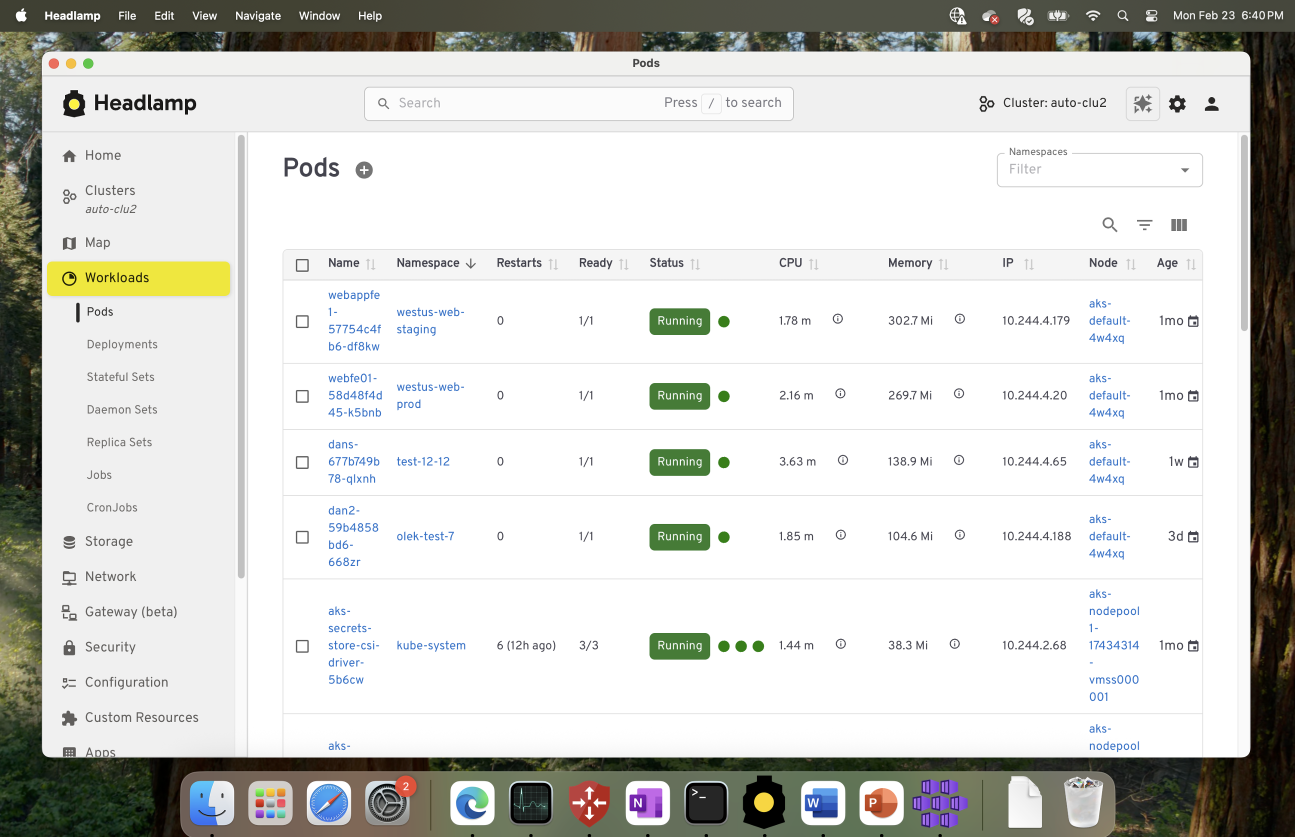
Viewing workloads and resources
In Kubernetes Dashboard, most users started by browsing workloads like pods, deployments, services, and namespaces. Headlamp keeps this same starting point. Workloads are easy to find and inspect, and moving between namespaces and clusters is simpler. Resources are still organized in familiar ways, and navigation feels smoother, especially when you work across multiple environments.
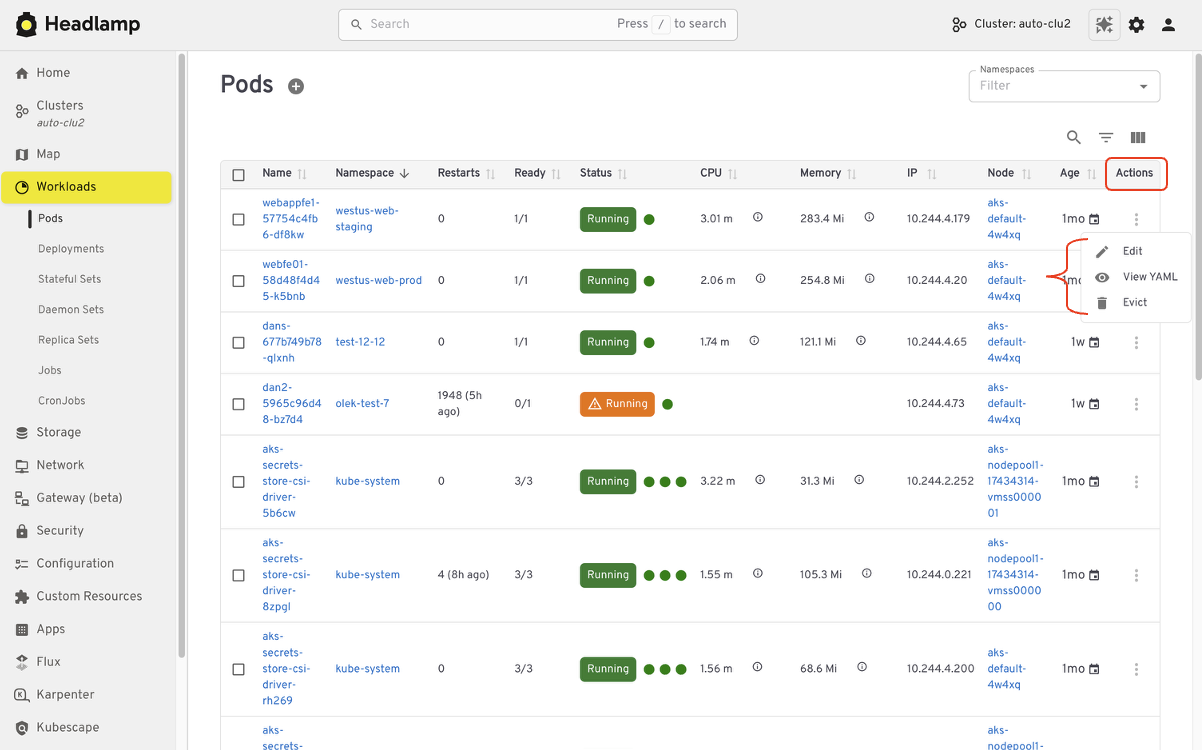
Editing and interacting with resources
Like Kubernetes Dashboard, Headlamp lets you view and edit manifests directly in the UI based on your permissions. You can delete resources, scale workloads, or update configurations from the interface. All actions follow standard Kubernetes RBAC. If you could perform an action in Dashboard, you will find the same capability in Headlamp, with the same respect for access controls.
Understanding relationships
Where Headlamp begins to expand the experience is in how it presents relationships between resources. In addition to list views, Headlamp offers visual ways to see how workloads, services, and configurations connect. This helps provide context without changing the underlying workloads users already rely on.
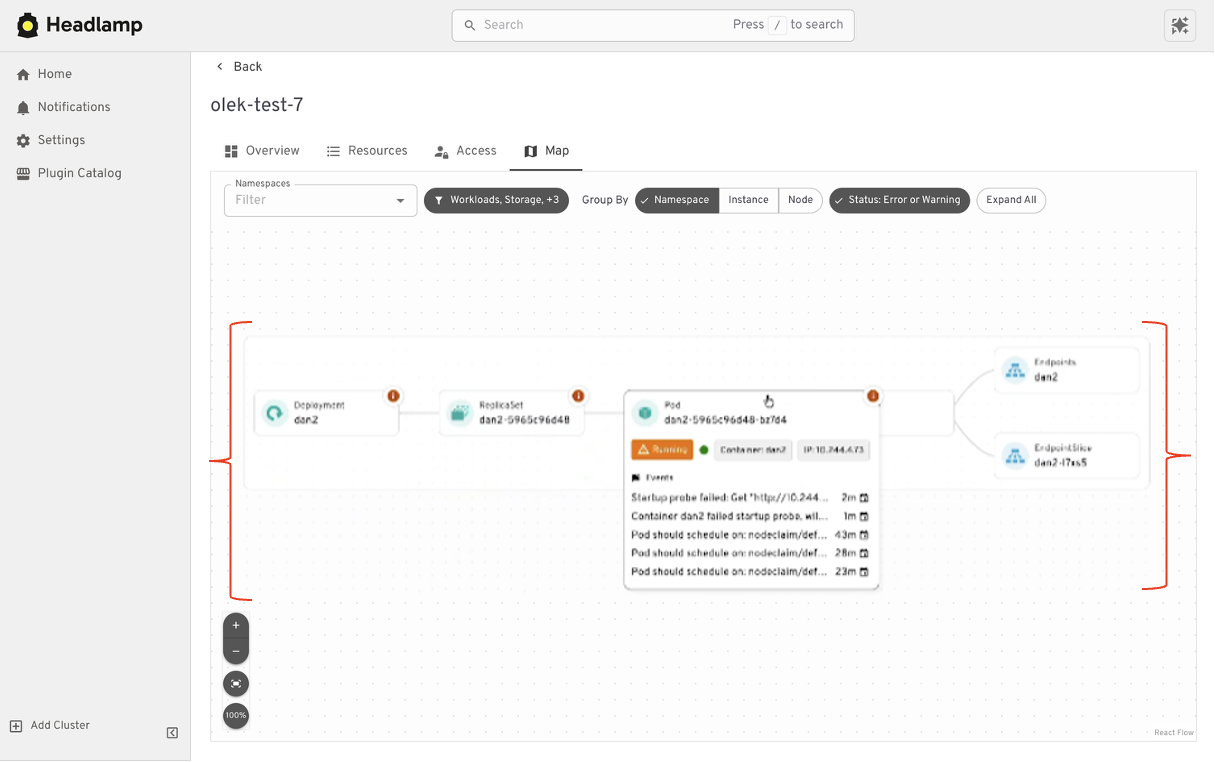
At a high level, the tasks you performed in Kubernetes Dashboard are still there. Headlamp keeps familiar workflows while making it easier to scale as clusters, teams, and applications grow.
Where Headlamp goes beyond Kubernetes Dashboard
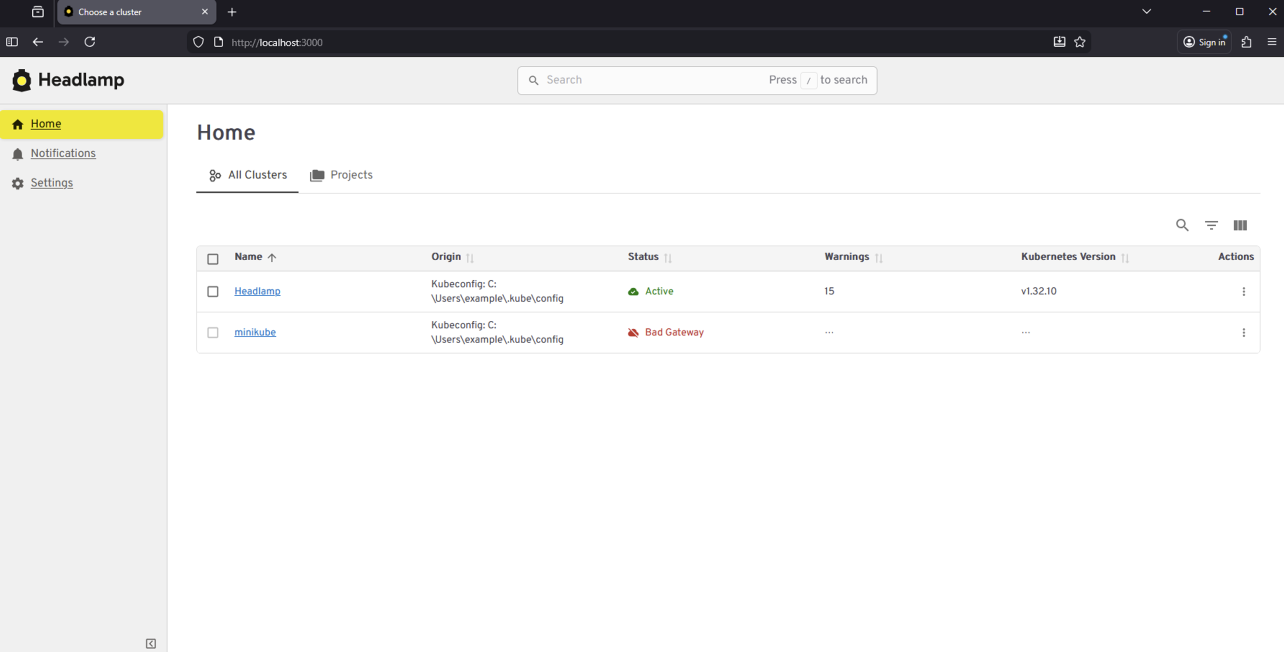
Expanding from single cluster to multi-cluster workflows
Kubernetes Dashboard was designed to work with one cluster at a time. That model worked well for simple setups, but it became limiting as teams adopted multiple environments. Headlamp expands this view by letting you work with multiple clusters from a single interface without switching tools or losing context. This makes it easier to manage development, staging, and production environments side by side.
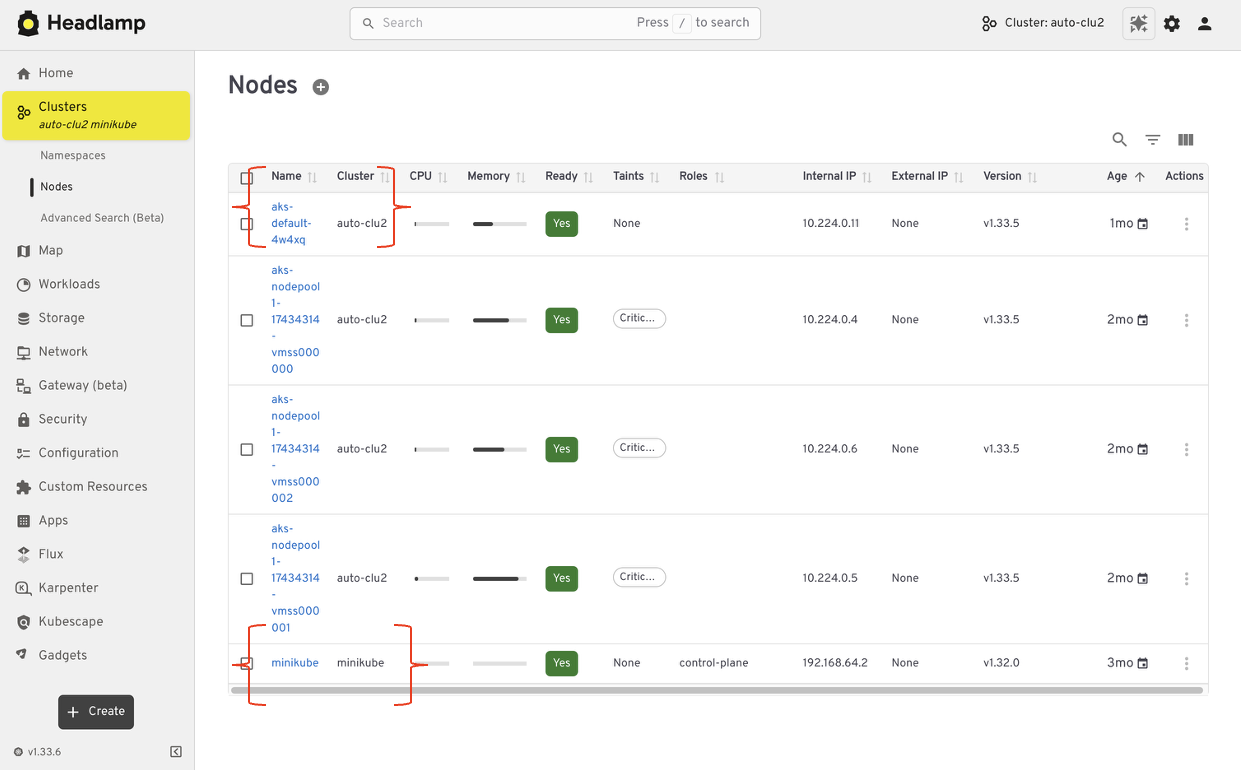
For teams running Kubernetes in more than one place, this shift reduces friction. You can stay oriented and move between clusters with confidence.
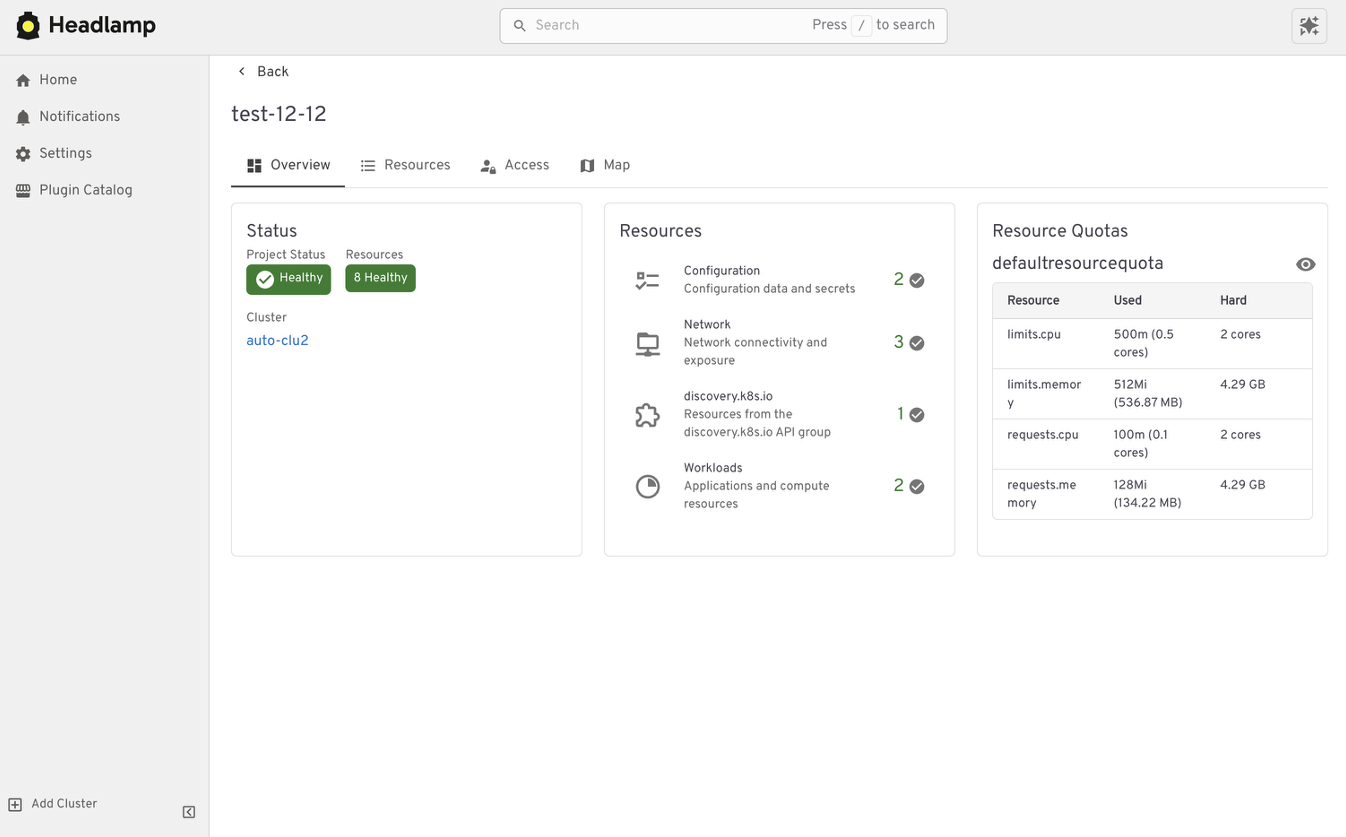
From resource lists to application context with Projects
Projects give you an application-centered way to view Kubernetes. Instead of jumping between lists, you can group related workloads, services, and supporting resources in one place. This makes applications easier to understand. You can see what belongs together, track changes in context, and troubleshoot without scanning the cluster piece by piece.
Projects are built on native Kubernetes concepts. Namespaces, labels, and RBAC continue to work the same way they always have. Headlamp adds a visual layer that brings related resources together.
Projects are optional. You can still work at the individual resource level when that fits your task. When you need more context, Projects help you step back and see the bigger picture.
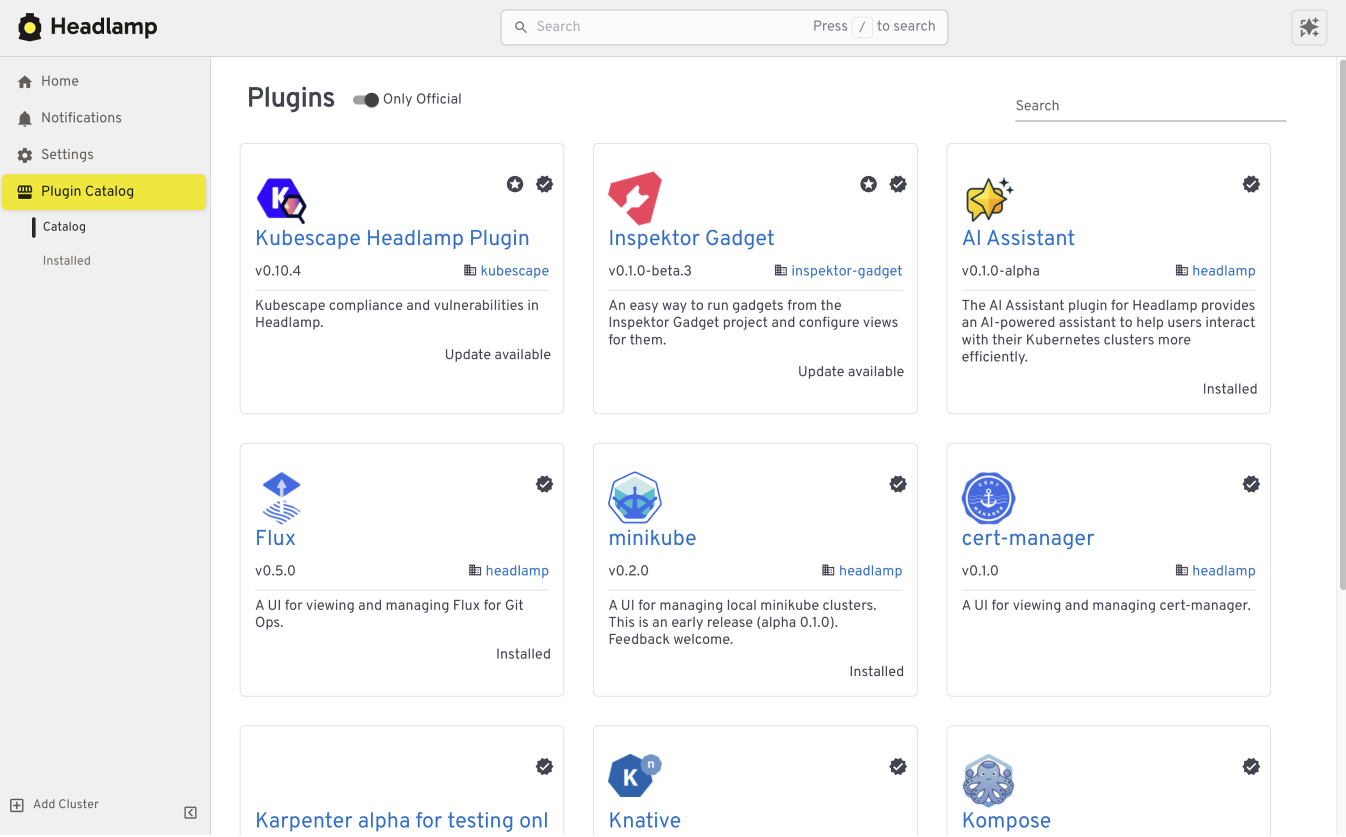
Extend the Headlamp UI with plugins
Headlamp can be extended through plugins that bring common workflows directly into the UI. Instead of switching tools, you work in one place with the same context.
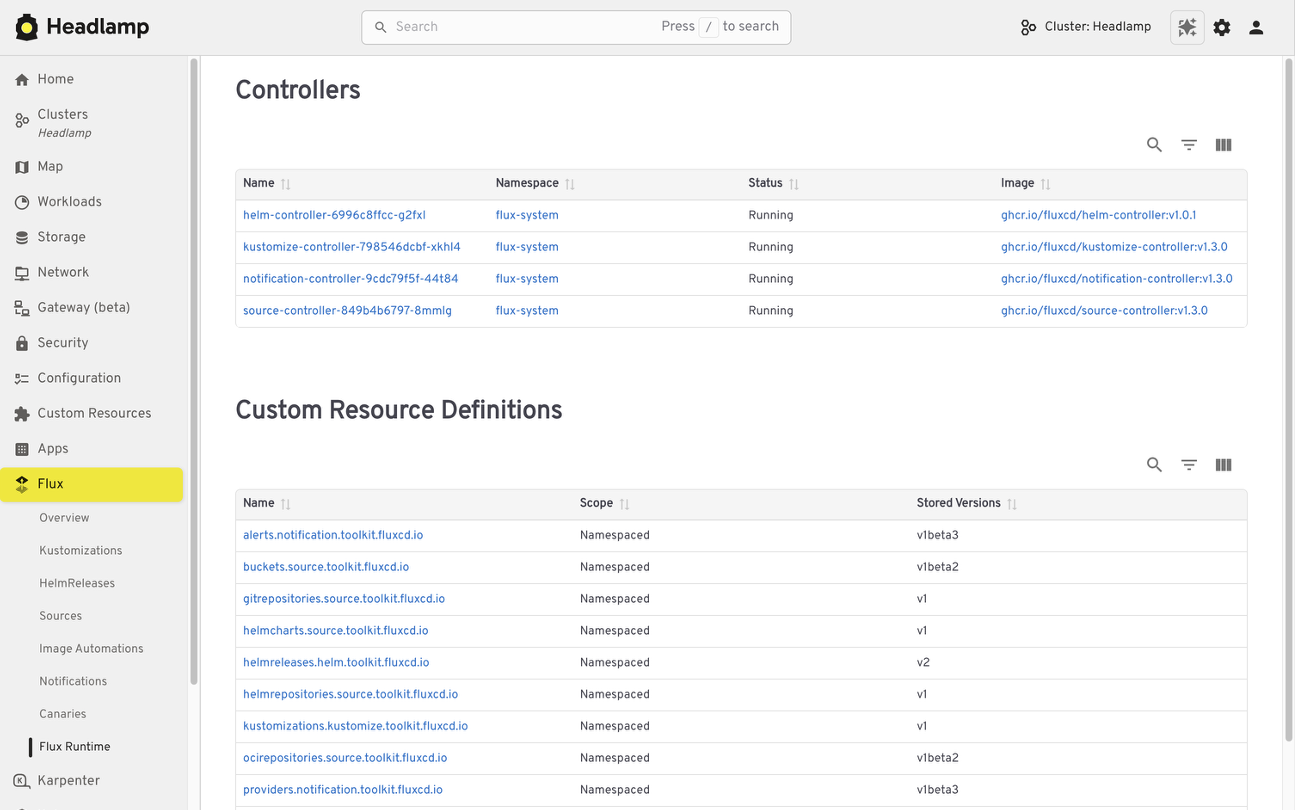
For example, the Flux plugin brings GitOps workflows into Headlamp. It allows teams to view application state alongside the Kubernetes resources that Flux manages, making it easier to understand how changes in Git relate to what is running in the cluster.
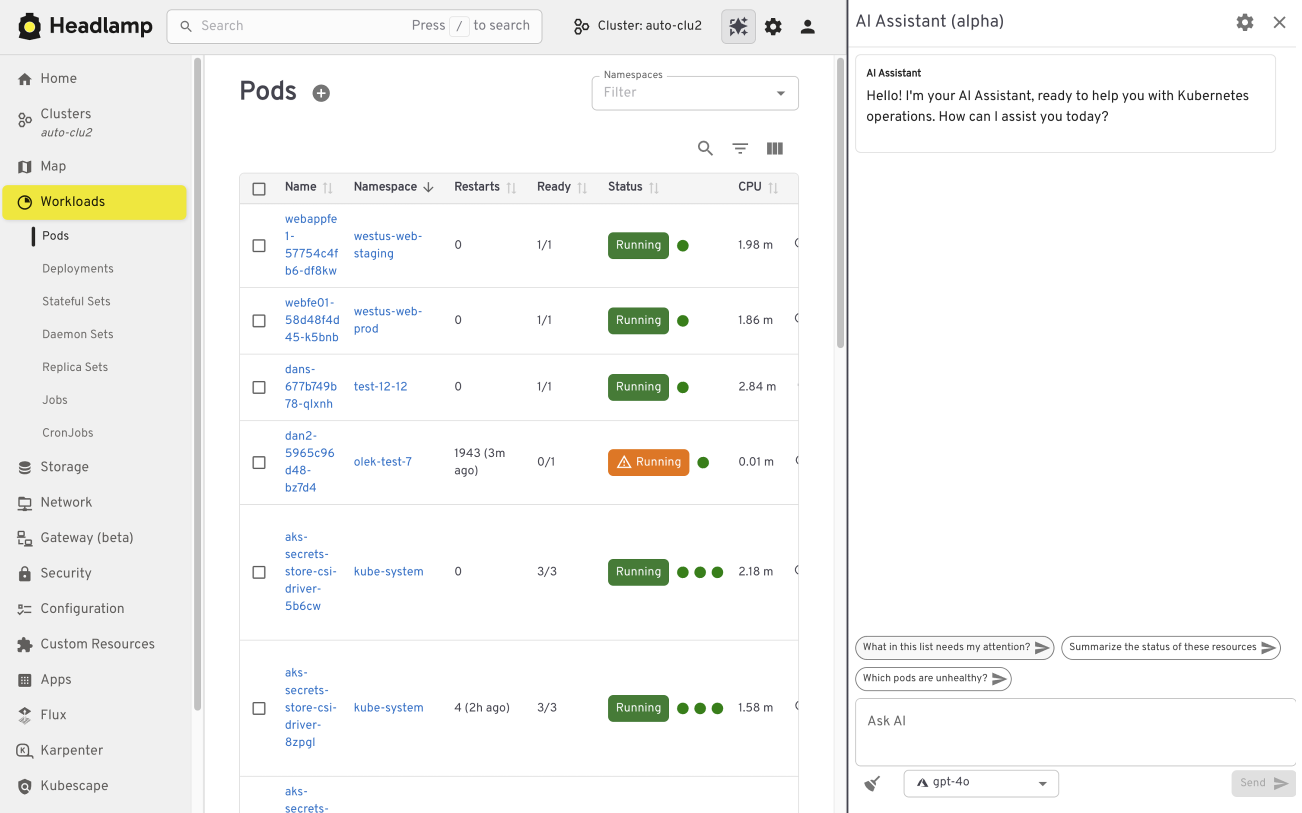
The AI Assistant follows a similar pattern. It adds a conversational layer to the UI that helps users understand what they are seeing, troubleshoot issues, or take action. All of this happens in the same screen where the problem appears.
Building your own plugins
Plugins are optional and not limited to community-built extensions. Platform and project teams can also create their own plugins. This allows organizations to add custom integrations that match their specific workflows and internal tooling, while keeping the user experience consistent.
Choosing how and where Headlamp runs
Headlamp gives teams flexibility in how they use a Kubernetes UI. You can run it directly in a cluster, use it as a desktop application, or combine both approaches based on your needs.
Running Headlamp in-cluster works well for shared environments. It provides a centrally managed UI with controlled access and fits naturally into Kubernetes setups, following the same authentication and RBAC rules as other in-cluster components.
The desktop application is often a better fit for local development and onboarding. It also works well when you need to manage multiple clusters from one place. Users can connect using their existing kubeconfig without deploying anything into the cluster.
These options are not mutually exclusive. Many teams use the desktop app for day-to-day work, while relying on an in-cluster deployment for shared or production environments.
Preparing for the Migration
Before moving from Kubernetes Dashboard to Headlamp, it can be helpful to pause and take stock of how you use the Dashboard today. A little reflection up front can go a long way toward making the transition feel smooth and familiar.
Start by noting which clusters and namespaces you access and how authentication works. Headlamp relies on standard Kubernetes authentication and RBAC. In most cases, existing access models carry over without change. If users already connect using kubeconfig files or service accounts, they will be able to access the same resources in Headlamp.
It is also useful to think about the workflows that matter most to your team. Some users rely on Dashboard for quick inspection or troubleshooting, while others use it for lightweight edits or validation. Headlamp supports these same workflows and adds optional capabilities on top. Knowing what you rely on today helps the transition feel predictable and confidence building.
If you would like to explore Headlamp or try it out before migrating, you can learn more at headlamp.dev.
This blog focused on understanding the transition and what to expect. A step by step migration guide is coming soon and will walk through installation and migration in detail.
etcd v3.7.0-rc.0 Now Available for Testing
SIG-Etcd announces the availability of etcd v3.7.0-rc.0, the first release candidate for the upcoming etcd v3.7.0 release.
This release candidate includes the long-requested RangeStream feature, removal of remaining legacy v2store components, protobuf refactoring, dependency updates, and performance improvements for large read workloads. It is not the final v3.7.0 release yet. The project is asking users and downstream projects to test this release candidate and report any issues before the final release.
Final Update for v3.4, plus 3.5.31, 3.6.12 Released
SIG-etcd has released the final patch update for v3.4 together with security updates for v3.5 and v3.6. Uses on v3.4 should begin the upgrade process as soon as possible. Users on v3.5 and v3.6 should update at the next scheduled maintenance window.
Obtain all three updates here:
Official container images are available from gcr.io.
Final v3.4 Release
This update marks the end of support (EOL) for v3.4, originally released in August 2019. No further patches will be issued by the Kubernetes project. If you are still using v3.4, please upgrade to a supported version as soon as you can.
Security Notice: Former Helm APT Mirror Domain `baltocdn.com` Statement
The Helm Security Team has received third-party reports that the ownership on the former community-maintained Debian/Ubuntu APT mirror domain, baltocdn.com, has changed after baltocdn.com's original registration lapsed.
And as a result, the new owners may be using the domain to serve malicious content.
We are publishing this notice to raise awareness for Helm users who may still have the configuration of their APT package manager referencing baltocdn.com.
baltocdn.com was previously used as the APT mirror for Helm distribution for many years, but it is no longer a Helm APT mirror, and must not be used to manage Helm.
Summary
The former Helm APT mirror domain baltocdn.com was decommissioned in September 2025.
Since decommissioning, attempts to access or download Helm packages from baltocdn.com should have failed due to the underlying serving infrastructure having been shut down.
The domain registration for baltocdn.com later expired and the domain was re-registered by a third party on May 19, 2026. As a result, users, systems, or automation still attempting to download Helm packages from baltocdn.com could be directed to content controlled by the new domain registrant.
At this time, the Helm Security Team has received third-party reports that the domain may have been repurposed to serve malicious content. We have not independently confirmed those reports. However, as the domain is no longer controlled by the previous APT repository operator and is no longer a Helm distribution endpoint, any continued use of baltocdn.com represents a potential supply chain risk.
Affected users
You may be affected if any Debian or Ubuntu based systems, APT repositories, CI jobs, container images, installation scripts, bootstrap scripts, configuration management templates, or internal documentation still reference:
baltocdn.com
Any user who executed binaries sourced from baltocdn.com after May 19, 2026 should consider the affected system compromised and follow their normal incident response procedures.
Users who have legacy references to baltocdn.com but have not attempted to install or update Helm from that domain after May 19, 2026 should still remove those references immediately using the steps below.
Remediation
Please ensure that all Debian/Ubuntu APT-based Helm installations use the current APT repository:
https://packages.buildkite.com/helm-linux/helm-debian
Review your systems and repositories for any remaining references to baltocdn.com and replace them with the current installation instructions.
The current Helm APT installation instructions are available at the link below:
https://helm.sh/docs/intro/install/#from-apt-debianubuntu
Recommended actions:
- Remove any APT source entries that reference
baltocdn.com. - Update Debian/Ubuntu APT-based Helm installation configuration to use
packages.buildkite.com. - Review CI/CD pipelines, Dockerfiles, bootstrap scripts, configuration management, and internal documentation for legacy references.
- Treat any system that executed binaries sourced from
baltocdn.comafter May 19, 2026 as potentially compromised. - Follow your organization’s incident response process if you believe a system may have downloaded or executed content from the repurposed domain.
- Disable access (corporate proxy/firewall, etc) to
baltocdn.com. Since the site was previously decommissioned and no longer serving content related to the Helm project, limiting access will not break existing workflows.
About the Helm APT repository
The Helm Debian/Ubuntu APT repository (and its baltocdn.com predecessor) is gratefully community maintained. It is not directly supported by the Helm maintainers.
The Helm project provides official methods for installing Helm from binary releases and from the Helm install script. Community-provided package manager installation methods, including APT, are documented for user convenience but are not directly supported by the Helm project.
Engage with the Helm Community
The Helm project provides multiple ways to interact with the community which include Slack channels and the weekly developers meeting. Members of the Helm security team and maintainers are present within these forums and, along with the rest of the community, can address questions or concerns related to Helm related topics.
Reporting security concerns
For more information about reporting security concerns associated with the Helm project, please see the Helm Security Process and Policy documentation:
https://helm.sh/community/security/
Conclusion
baltocdn.com is no longer a Helm APT mirror and should not be used to install and manage Helm.
Users should migrate any remaining Debian/Ubuntu APT-based Helm installation configuration to packages.buildkite.com and review their environments for legacy references to the former domain to mitigate potential security concerns.
Reconciling the Past: Correcting Records for Unfixed Kubernetes CVEs
The Kubernetes project relies on transparency to empower cluster administrators and security researchers. One important way we do that is by publishing CVE records into the Common Vulnerabilities and Exposures database. As part of our ongoing effort to mature the official Kubernetes CVE Feed, we have identified some discrepancies. CVE records for a few older, unfixed issues incorrectly include a fixed version field.
The Kubernetes Security Response Committee (SRC) will correct the affected CVE records on June 1, 2026. This may result in vulnerability scanners identifying these vulnerabilities in places where they were previously not detected.
To help reduce confusion, this post provides a technical update on three vulnerabilities that were disclosed in previous years but remain unfixed: CVE-2020-8561, CVE-2020-8562, and CVE-2021-25740.
Why we are updating these records now
While these vulnerabilities have been public for several years, the recent work to generate official Open Source Vulnerabilities (OSV) files revealed that their corresponding CVE records did not accurately reflect their status. Specifically, some records suggested a fixed version existed, when in reality, these issues are architectural design trade-offs that cannot be fully remediated through code without breaking fundamental Kubernetes functionality.
Correcting these records is vital for the community for:
- Automation Fidelity: Modern vulnerability scanners depend on precise version ranges. Inaccurate fixed tags lead to false negatives, giving users a false sense of security.
- Risk Documentation: By formalizing these as unfixed, we ensure that platform providers and administrators are aware of the persistent need for administrative mitigations.
For completeness, we should also mention that CVE-2020-8554 is an unfixed CVE with a correct CVE record stating that it affects all versions. That record will also be updated to use a more-standardized version number format.
Technical analysis of unfixed architectural risks
The following vulnerabilities will not be fixed by the Kubernetes project. GitHub issues remain the best reference for the technical mechanics of these flaws.
CVE-2020-8561: Webhook redirect in kube-apiserver
- Severity: Medium (4.1).
- The Issue: The kube-apiserver follows HTTP redirects when communicating with admission webhooks. An actor capable of configuring an AdmissionWebhookConfiguration can redirect API server requests to internal, private networks.
- Why it remains unfixed: Restricting this behavior would require breaking the standard HTTP client behavior that many legitimate integrations rely on.
- Mitigation: Set the API server log level to less than 10 (to prevent logging response bodies) and disable
dynamic profiling (
--profiling=false) to prevent unauthorized log-level changes.
CVE-2020-8562: Proxy bypass via DNS TOCTOU
- Severity: Low (3.1).
- The Issue: A Time-of-Check to Time-of-Use (TOCTOU) race condition in the API server proxy allows users to bypass IP restrictions. The system performs a DNS check to validate an IP, but then performs a second resolution for the actual connection, which an attacker can manipulate.
- Why it remains unfixed: Fixing this requires pinning resolved IPs in a way that breaks complex split-horizon DNS or dynamic IP environments.
- Mitigation: Use a local DNS caching server like dnsmasq for the API server and configure
min-cache-ttlto enforce consistent responses between the check and the connection.
CVE-2021-25740: Cross-namespace forwarding via Endpoints
- Severity: Low (3.1).
- The Issue: A design flaw in the Endpoints and EndpointSlice API objects allows users to manually specify IP addresses, which can be used to point a LoadBalancer or Ingress toward backends in other namespaces.
- Why it remains unfixed: This is a fundamental feature of the Endpoints API used by many networking tools and operators.
- Mitigation: Restrict write access to Endpoints (legacy) and EndpointSlices. Since Kubernetes 1.22,
Kubernetes RBAC authorization mode no longer includes those permissions in the default edit and admin
ClusterRoles. That removal applies to clusters created using Kubernetes v1.22; for clusters upgraded from
older versions, administrators should manually audit and reconcile the
system:aggregate-to-editClusterRole.
Note:
On June 1, 2026, these CVE records will be updated to correctly reflect the fact that all versions are affected. You may see them begin to appear in vulnerability scanner results.Required actions for administrators
The Kubernetes project recommends a secure by configuration approach to manage these persistent risks:
Vulnerability Action item Severity score (Rating) Command / configuration CVE-2020-8561 Restrict Log Verbosity 4.1 (Medium) Ensure--v is set to < 10 and --profiling=false.
CVE-2020-8562
Enforce DNS Consistency
3.1 (Low)
Deploy dnsmasq or a similar caching resolver on control plane nodes.
CVE-2021-25740
Hardened RBAC
3.1 (Low)
kubectl auth reconcile to remove Endpoints write access from broad roles.
The RBAC action for CVE-2021-25740 applies when your cluster uses RBAC authorization mode, which is the default for clusters created with standard Kubernetes tooling. Administrators should independently test and validate these configurations in a non-production environment, assessing the architectural risks against their specific threat model and risk tolerance.
Conclusion: maturity through transparency
The effort to reconcile these records is a sign of a maturing security ecosystem. By moving away from the "patch-only" mindset and accurately documenting architectural debt, the Kubernetes project provides the community with the high-fidelity data needed to secure modern cloud native infrastructure.
We would like to thank the security researchers—QiQi Xu, Javier Provecho, and others—who identified these risks, and the SIG Security Tooling contributors who continue to refine our official feeds. Special shoutout to Rory McCune for sharing information around these CVEs through his blog posts.
Introducing Native ClickHouse Support in Jaeger
 Photo by Puscas Adryan on Unsplash
Jaeger v2.18.0 introduces native ClickHouse support as a new storage backend. ClickHouse has been one of the most frequently requested options from users running Jaeger at scale, and this release makes it possible to use it directly with Jaeger.
In this post, I’ll walk you through why ClickHouse is such a powerhouse for storing traces, how the schema is designed under the hood, and how you can start using it with Jaeger today.
Why ClickHouse?
Distributed tracing produces a massive volume of semi-structured event data. Storing that data is only half the problem. Users also need to search by service, operation, tags, duration, time range, and trace ID, often across large datasets. Existing Jaeger backends such as Cassandra and Elasticsearch/OpenSearch work well for many deployments, but they also come with operational tradeoffs around indexing, scaling, retention, and query cost.
High-Throughput Ingest + Low Latency Queries
ClickHouse is a column-oriented OLAP database designed for high-throughput ingestion, compression, and analytical queries. Those characteristics map naturally to trace workloads, where users often scan and filter large amounts of repetitive telemetry data.
Compression That Actually Matters
Trace data is especially compression-friendly because fields like service names, operation names, tag keys, status codes, and resource attributes repeat frequently. Storing those fields column-by-column rather than row-by-row reduces disk usage and I/O, which improves both storage efficiency and query performance.
Real-Time Analytics
ClickHouse also opens the door to richer analytical queries over trace data. Because aggregations are efficient on columnar storage, Jaeger can support use cases such as service-level latency, error-rate, and throughput analysis directly from stored spans, depending on the capabilities exposed by the backend.
Designing The Schema
A major part of the work was designing a schema that matches Jaeger’s core query patterns: trace lookup by trace ID, search by service and operation, filtering by attributes, time-range queries, and aggregation for Jaeger’s Service Performance Monitoring (SPM) feature.
There’s an excellent earlier post by Ha Anh Vu that benchmarked ClickHouse schemas for jaeger-v1, and that work laid the foundation. However, jaeger-v2 adopts the OpenTelemetry data model, which forces us to revisit several decisions.
The full design space is in the Architecture Design Record (ADR). The sections below walk through some of the decisions that are worth calling out.
Choosing a Primary Key
In ClickHouse, the primary key isn’t a uniqueness constraint. Instead, it defines the on-disk sort order and powers a sparse index (one entry per 8,192-row granule). Picking it is the single highest-leverage decision in the schema.
We had two candidates for choosing a primary key:
- Optimize for trace retrieval: sort by trace_id. Every span of a trace lands in one contiguous block, so GetTrace is a single seek + sequential read. However, search queries pay for this optimization because service_name and operation_name filters cannot use the primary key index at all.
- Optimize for search (chosen): sort by (service_name, name, start_time). Search queries, which filter by service, operation, and a time window become direct primary-key lookups.
The decision came down to an asymmetric trade-off. Sorting by trace_id makes search performance terrible, but sorting by (service_name, name, start_time) hurts trace retrieval much less, because we can recover most of the lost performance with two cheap mechanisms:
- A bloom_filter skip index on trace_id, which lets the engine prove a granule can’t contain a given ID without reading it.
- A trace_id_timestamps materialized view (described below) that tells the search path each matching trace’s time bounds, so the follow-up GetTraces call can prune partitions and granules.
An earlier benchmark run with the schema sorted by trace_id showed the asymmetry concretely. Trace retrieval was about 27 ms, but a search query took ~880 ms. Re-sorting by (service_name, name, start_time) pushed trace retrieval to ~100 ms (slower, but still well under interactive thresholds) while bringing multi-filter search down to ~140 ms.
Storing Typed Attributes
In jaeger-v1, tags were always strings. The v2 reader API accepts a typed map, where attributes can be Bool, Int64, Float64, String, or one of the complex types (Bytes, Slice, Map). We need to query across these types, so the storage layer can’t collapse everything to strings.
The schema leverages ClickHouse’s Nested column per primitive type, repeated at the span, event, link, resource, and scope level. As the name implies, a Nested column behaves like a small sub-table inside each row, so attribute filters can use the same query semantics as querying a regular table.
However, it is worth noting that attribute-only searches are inherently more expensive because they cannot fully leverage ClickHouse’s primary index. The table’s index is optimized around top-level structural fields — specifically service, operation, and time. For optimal query performance and to prevent heavy column scans, users should always combine attribute filters with these fields to limit the data ClickHouse has to scan.
Materialized Views
Some of Jaeger’s queries don’t fit the spans table’s sort order. For example, the Jaeger UI needs to quickly load the full list of known service names and operations, while trace searches often need efficient access to trace time ranges.
Rather than answering these with expensive table scans, we use materialized views to precompute the data. In ClickHouse, materialized views automatically transform inserts into a source table and write the results into optimized target tables.
This approach is used to speed up queries for service names, operations, and trace ID timestamp ranges.
Resolving Typed Attributes
A technical challenge that may not be immediately obvious from the span’s schema: how the storage layer interprets attribute lookups. For instance, when searching for http.status_code=200, the system cannot inherently distinguish if “200” is a string, an integer, a span-level attribute, or a resource-level attribute. Depending on the service, the same logical key could be categorized under str_attributes or int_attributes, and it might exist at any of the five data levels: resource, scope, span, event, or link.
To solve this, we maintain a dedicated attribute_metadata table, populated by materialized views off the spans table. This allows the reader to look up the filter key at query time and only query the columns for the types and levels that were observed.
Benchmarks
We benchmarked the ClickHouse backend using 10 million spans across 1 million traces on a single-node ClickHouse deployment. The benchmark measured ingestion throughput, compression, trace retrieval, and search latency.
The backend sustained more than 50k spans/sec during ingestion, achieved an 8.6× compression ratio on the spans table, retrieved traces in around 100 ms, and kept most search queries under 50 ms. More complex filtered queries completed in about 140 ms.
These numbers are encouraging, but they should be read in the context of the benchmark environment and dataset. Full methodology, configuration, and query details are available in the benchmarking report.
Getting Started
ClickHouse support is available in alpha as a storage backend starting with Jaeger v2.18.0. You’ll need a running ClickHouse instance and the jaeger-v2 configuration for the ClickHouse backend. The full instructions are described in the setup guide.
Closing Thoughts
Being a Jaeger maintainer has been one of the most rewarding parts of my career so far. If you want to chat about this work, contribute, or report issues, please open one on GitHub or find us in the CNCF #jaeger Slack.
Introducing Native ClickHouse Support in Jaeger was originally published in JaegerTracing on Medium, where people are continuing the conversation by highlighting and responding to this story.
Announcing etcd 3.7.0-beta.0
SIG-Etcd announces the availability of the first beta release of etcd v3.7.0. This new version of the popular distributed database and key Kubernetes component includes the long-requested RangeStream feature, as well as a refactoring and cleanup of multiple legacy components and interfaces. v3.7 will deliver improved security, better operational reliability, and an improved experience for working with large resultsets.
First, however, the project needs users to test the beta. You can find v3.7.0-beta.0 here:
Please try it out and report issues in the etcd repo.
This beta also determines the EOL of version 3.4.
RangeStream
In etcd v3.6 and earlier, it is challenging to work with requests that return large resultsets. The client or requesting application is forced to wait for the full result set, leading to unpredictable latency and memory usage. The RangeStream RPC lets calling applications accept result sets in chunks, reducing latency and making buffering memory usage more predictable.
Much of the work on RangeStream was done by a relatively new contributor to etcd, Jeffrey Ying, a software engineer at Google. New contributors can have a substantial impact on etcd development.
"I've always been fascinated by database internals, and building RangeStream was a great opportunity to solve a bottleneck we were hitting in production with Kubernetes. It was the perfect opportunity to collaborate across projects and improve the ecosystem as a whole. Jumping into etcd as a new contributor had a bit of a learning curve, but the community is incredibly welcoming. The leads were very receptive to my ideas and helped me iterate quickly, while maintaining the project's high bar for reliability and code quality," said Jeffrey.
Instructions on how to use RangeStream in gRPC calls and in etcdctl can be found in the etcd documentation. Users should try it out for their own applications.
Removal of v2store
The last vestiges of etcd v2store have been removed in v3.7, making this the first release that is 100% on v3store. This includes discovery, bootstrap, v2 requests, and the v2 client. Our team has also removed multiple deprecated experimental flags.
All of these changes may create some breakage for users, particularly those who have not already updated to v3.6.11. We are interested in hearing about blockers encountered by users and dependent applications; please report anything you find that can't be remedied or needs better upgrade documentation.
etcd v3.7.0-beta.0 also includes bbolt v1.5.0 and raft v3.7.0.
3.4 EOL
According to our community support policy, we typically maintain only the latest two minor versions, currently v3.6 and v3.5. Etcd v3.5 will be supported for 1 year after v3.7.0 final release.
As mentioned in extended support for v3.4 in the etcd v3.6.0 release announcement, etcd v3.4 has been EOL since May 15, 2026. SIG-etcd may release one more security patch for that version at the end of May, if warranted by patched vulnerabilities. In any case, it will cease being updated after the end of May. Users on v3.4 should be planning to upgrade their clusters.
Feedback and Future Betas
Reach the etcd contributors with your feedback about v3.7.0-beta.0 in any of the following places:
SIG-etcd may release additional betas of version v3.7.0 with additional refactoring, particularly of our use of protobuf libraries. Release candidates and the final release will probably happen through June, possibly into early July.
Announcing etcd v3.7.0-beta.0
SIG-Etcd announces the availability of the first beta release of etcd v3.7.0. This new version of the popular distributed database and key Kubernetes component includes the long-requested RangeStream feature, as well as a refactoring and cleanup of multiple legacy components and interfaces. v3.7 will deliver improved security, better operational reliability, and an improved experience for working with large resultsets.
First, however, the project needs users to test the beta. You can find v3.7.0-beta.0 here:
The Proxy Died First: How Kubernetes Native Sidecars Solve the Service Mesh Shutdown Problem
If you’ve ever operated a service mesh on Kubernetes, you’ve probably seen something like this during a rolling deployment:
Unexpected error occurred: Client 'http://my-api:8080/': Connect Error:
Connection refused: my-api/100.20.100.200:8080
One second your pod is humming along, serving traffic, and talking to its
upstream dependencies through the mesh. The next second it enters Terminating
state, the sidecar proxy exits, and every in-flight request to a dependent
service gets a cold Connection refused in response.
Kubernetes v1.36: New Metric for Route Sync in the Cloud Controller Manager
This article was originally published with the wrong date. It was later republished, dated the 15th of May 2026.
Kubernetes v1.36 introduces a new alpha counter metric route_controller_route_sync_total
to the Cloud Controller Manager (CCM) route controller implementation at
k8s.io/cloud-provider. This metric
increments each time routes are synced with the cloud provider.
A/B testing watch-based route reconciliation
This metric was added to help operators validate the
CloudControllerManagerWatchBasedRoutesReconciliation feature gate introduced in
Kubernetes v1.35.
That feature gate switches the route controller from a fixed-interval loop to a watch-based
approach that only reconciles when nodes actually change. This reduces unnecessary API calls
to the infrastructure provider, lowering pressure on rate-limited APIs and allowing operators
to make more efficient use of their available quota.
To A/B test this, compare route_controller_route_sync_total with the feature gate
disabled (default) versus enabled. In clusters where node changes are infrequent, you should
see a significant drop in the sync rate with the feature gate turned on.
Example: expected behavior
With the feature gate disabled (the default fixed-interval loop), the counter increments steadily regardless of whether any node changes occurred:
# After 10 minutes with no node changes
route_controller_route_sync_total 60
# After 20 minutes, still no node changes
route_controller_route_sync_total 120
With the feature gate enabled (watch-based reconciliation), the counter only increments when nodes are actually added, removed, or updated:
# After 10 minutes with no node changes
route_controller_route_sync_total 1
# After 20 minutes, still no node changes — counter unchanged
route_controller_route_sync_total 1
# A new node joins the cluster — counter increments
route_controller_route_sync_total 2
The difference is especially visible in stable clusters where nodes rarely change.
Where can I give feedback?
If you have feedback, feel free to reach out through any of the following channels:
- The #sig-cloud-provider channel on Kubernetes Slack
- The KEP-5237 issue on GitHub
- The SIG Cloud Provider community page for other communication channels
How can I learn more?
For more details, refer to KEP-5237.
Kubernetes v1.36: Mixed Version Proxy Graduates to Beta
Back in Kubernetes 1.28, we introduced the Mixed Version Proxy (MVP) as an Alpha feature (under the feature gate UnknownVersionInteroperabilityProxy) in a previous blog post. The goal was simple but critical: make cluster upgrades safer by ensuring that requests for resources not yet known to an older API server are correctly routed to a newer peer API server, instead of returning an incorrect 404 Not Found.
We are excited to announce that the Mixed Version Proxy is moving to Beta in Kubernetes 1.36 and will be enabled by default! The feature has evolved significantly since its initial release, addressing key gaps and modernizing its architecture.
Here is a look at how the feature has evolved and what you need to know to leverage it in your clusters.
What problem are we solving?
In a highly available control plane undergoing an upgrade, you often have API servers running different versions. These servers might serve different sets of APIs (Groups, Versions, Resources).
Without MVP, if a client request lands on an API server that does not serve the requested resource (e.g., a new API version introduced in the upgrade), that server returns a 404 Not Found. This is technically incorrect because the resource is available in the cluster, just not on that specific server. This can lead to serious side effects, such as mistaken garbage collection or blocked namespace deletions.
MVP solves this by proxying the request to a peer API server that can serve it.
How has it evolved since 1.28
The initial Alpha implementation was a great proof of concept, but it had some limitations and relied on older mechanisms. Here is how we have modernized it for Beta:
-
From StorageVersion API to Aggregated Discovery In the Alpha version, API servers relied on the
StorageVersion APIto figure out which peers served which resources. While functional, this approach had a significant limitation: theStorageVersion APIis not yet supported for CRDs and aggregated APIs. For Beta, we have replaced the reliance onStorageVersion APIcalls with the use ofAggregated Discovery. API servers now use the aggregated discovery data to dynamically understand the capabilities of their peers. -
The Missing Piece: Peer-Aggregated Discovery The 1.28 blog post noted a significant gap: while we could proxy resource requests, discovery requests still only showed what the local API server knew about. In 1.36, we have added
Peer-Aggregated Discoverysupport! Now, when a client performs discovery (e.g., listing available APIs), the API server merges its local view with the discovery data from all active peers. This provides clients with a complete, unified view of all APIs available across the entire cluster, regardless of which API server they connected to.
While peer-aggregated discovery will be the default behavior (note that peer-aggregated discovery is enabled if the --peer-ca-file flag is set, otherwise the server will fallback to showing only its local APIs), there may be cases where you need to inspect only the resources served by the specific API server you are connected to. You can request this non-aggregated view by including the profile=nopeer parameter in your request's Accept header (e.g., Accept: application/json;g=apidiscovery.k8s.io;v=v2;as=APIGroupDiscoveryList;profile=nopeer).
Required configuration
While the feature gate will be enabled by default, it requires certain flags to be set to allow for secure communication between peer API servers. To function correctly, make sure your API server is configured with the following flags:
--feature-gates=UnknownVersionInteroperabilityProxy=true: This will be default in 1.36, but it is good to verify--peer-ca-file=<path-to-ca>: [CRITICAL] This is a required flag. You must provide the CA bundle that the source API server will use to authenticate the serving certificates of destination peer API servers. Without this, proxying will fail due to TLS verification errors.--peer-advertise-ipand--peer-advertise-port: These flags are used to set the network address that peers should use to reach this API server. If unset, the values from--advertise-addressor--bind-addressare used. If you have complex network topologies where API servers communicate over a specific internal interface, setting these flags explicitly is highly recommended.
Configuring with kubeadm
If you manage your cluster with kubeadm, you can configure these flags in your ClusterConfiguration file:
apiVersion: kubeadm.k8s.io/v1beta4
kind: ClusterConfiguration
apiServer:
 extraArgs:
 peer-ca-file: "/etc/kubernetes/pki/ca.crt"
 # peer-advertise-ip and port if needed
Call to action
If you are running multi-master clusters and upgrading them regularly, the Mixed Version Proxy is a major safety improvement. With it becoming default in 1.36, we encourage you to:
- Review your API server flags to ensure
--peer-ca-fileis set properly. - Test the feature in your staging environments as you prepare for the 1.36 upgrade.
- Provide feedback to SIG API Machinery (Slack, mailing list, or by attending SIG API Machinery meetings) on your experience.
Kubernetes v1.36: Deprecation and removal of Service ExternalIPs
The .spec.externalIPs field for Service was an early attempt to provide
cloud-load-balancer-like functionality for non-cloud clusters.
Unfortunately, the API assumes that every user in the cluster is fully
trusted, and in any situation where that is not the case, it enables
various security exploits, as described in
CVE-2020-8554.
Since Kubernetes 1.21, the Kubernetes project has recommended that all users disable
.spec.externalIPs. To make that easier, Kubernetes also added an admission controller
(DenyServiceExternalIPs) that can be enabled to do this. At the time,
SIG Network felt that blocking the functionality by default was too large a
breaking change to consider.
However, the security problems are still there, and as a project we're increasingly unhappy with the "insecure by default" state of the feature. Additionally, there are now several better alternatives for non-cloud clusters wanting load-balancer-like functionality.
As a result, the .spec.externalIPs field for Service is now formally deprecated in Kubernetes 1.36.
We expect that a future minor release of Kubernetes will drop
implementation of the behavior from kube-proxy, and will update the
Kubernetes conformance criteria to require that conforming implementations
do not provide support.
A note on terminology, and what hasn't been deprecated
The phrase external IP is somewhat overloaded in Kubernetes:
-
The Service API has a field
.spec.externalIPsthat can be used to add additional IP addresses that a Service will respond on. -
The Node API's
.status.addressesfield can list addresses of several different types, one of which is calledExternalIP. -
The
kubectltool, when displaying information about a Service of type LoadBalancer in the default output format, will show the load balancer IP address under the column headingEXTERNAL-IP.
This deprecation is about the first of those. If you are not setting
the field externalIPs in any of your Services, then it does not
apply to you.
That said, as a precaution, you may still want to enable the DenyServiceExternalIPs admission controller to
block any future use of the externalIPs field.
Alternatives to externalIPs
If you are using .spec.externalIPs, then there are several alternatives.
Consider a Service like the following:
apiVersion: v1
kind: Service
metadata:
 name: my-example-service
spec:
 type: ClusterIP
 selector:
 app.kubernetes.io/name: my-example-app
 ports:
 - protocol: TCP
 port: 80
 targetPort: 8080
 externalIPs:
 - "192.0.2.4"
Using manually-managed LoadBalancer Services instead of externalIPs
The easiest (but also worst) option is to just switch from using
externalIPs to using a type: LoadBalancer service, and assigning a
load balancer IP by hand. This is, essentially, exactly the same as
externalIPs, with one important difference: the load balancer IP is
part of the Service's .status, not its .spec, and in a cluster
with RBAC enabled, it can't be edited by ordinary users by default.
Thus, this replacement for externalIPs would only be available to
users who were given permission by the admins (although those users
would then be fully empowered to replicate CVE-2020-8554; there would
still not be any further checks to ensure that one user wasn't
stealing another user's IPs, etc.)
Because of the way that .status works in Kubernetes, you must create the
Service without a load balancer IP, and then add the IP as a second step:
$ cat loadbalancer-service.yaml
apiVersion: v1
kind: Service
metadata:
 name: my-example-service
spec:
 # prevent any real load balancer controllers from managing this service
 # by using a non-existent loadBalancerClass
 loadBalancerClass: non-existent-class
 type: LoadBalancer
 selector:
 app.kubernetes.io/name: my-example-app
 ports:
 - protocol: TCP
 port: 80
 targetPort: 8080
$ kubectl apply -f loadbalancer-service.yaml
service/my-example-service created
$ kubectl patch service my-example-service --subresource=status --type=merge -p '{"status":{"loadBalancer":{"ingress":[{"ip":"192.0.2.4"}]}}}'
Using a non-cloud based load balancer controller
Although LoadBalancer services were originally designed to be backed by
cloud load balancers, Kubernetes can also support them on non-cloud platforms
by using a third-party load balancer controller such as MetalLB.
This solves the security problems associated with externalIPs because the
administrator can configure what ranges of IP addresses the controller will assign
to services, and the controller will ensure that two services can't both use the same
IP.
So, for example, after installing and configuring MetalLB, a cluster administrator could configure a pool of IP addresses for use in the cluster:
apiVersion: metallb.io/v1beta1
kind: IPAddressPool
metadata:
 name: production
 namespace: metallb-system
spec:
 addresses:
 - 192.0.2.0/24
 autoAssign: true
 avoidBuggyIPs: false
After which a user can create a type: LoadBalancer Service and MetalLB will handle the
assignment of the IP address. MetalLB even supports the deprecated loadBalancerIP
field in Service, so the end user can request a specific IP (assuming it is available)
for backward-compatibility with the externalIPs approach, rather than being
assigned one at random:
apiVersion: v1
kind: Service
metadata:
 name: my-example-service
spec:
 type: LoadBalancer
 selector:
 app.kubernetes.io/name: my-example-app
 ports:
 - protocol: TCP
 port: 80
 targetPort: 8080
 loadBalancerIP: "192.0.2.4"
Similar approaches would work with other load balancer controllers. This approach can allow cluster administrators to have control over which IP addresses are assigned, rather than users.
Using Gateway API
Another potential solution is to use an implementation of the Gateway API.
Gateway API allows cluster administrators to define a Gateway resource, which can have an IP address
attached to it via the .spec.addresses field. Since Gateway resources are designed to be managed by
cluster administrators, RBAC rules can be put in place to only allow privileged users to manage them.
An example of how this could look is:
apiVersion: gateway.networking.k8s.io/v1
kind: Gateway
metadata:
 name: example-gateway
spec:
 gatewayClassName: example-gateway-class
 addresses:
 - type: IPAddress
 value: "192.0.2.4"
---
apiVersion: gateway.networking.k8s.io/v1
kind: HTTPRoute
metadata:
 name: example-route
spec:
 parentRefs:
 - name: example-gateway
 rules:
 - backendRefs:
 - name: example-svc
 port: 80
---
apiVersion: v1
kind: Service
metadata:
 name: example-svc
spec:
 type: ClusterIP
 selector:
 app.kubernetes.io/name: example-app
 ports:
 - protocol: TCP
 port: 80
 targetPort: 8080
The Gateway API project is the next generation of Kubernetes Ingress, Load Balancing, and Service Mesh APIs within Kubernetes. Gateway API was designed to fix the shortcomings of the Service and Ingress resource, making it a very reliable robust solution that is under active development.
Timeline for externalIPs deprecation
The rough timeline for this deprecation is as follows:
- With the release of Kubernetes 1.36, the field was deprecated; Kubernetes now emits warnings when a user uses this field
- About a year later (v1.40 at the earliest) support for
.spec.externalIPswill be disabled in kube-proxy, but users will have a way to opt back in should they require more time to migrate away - About another year later - (v1.43 at the earliest) support will be disabled completely; users won't have a way to opt back in
When AI agents become contributors: How KubeStellar reached 81% PR acceptance
In mid-December, I started building KubeStellar Console from scratch. It’s a multi-cluster management dashboard for Kubernetes, and it sits inside the KubeStellar project in the Cloud Native Computing Foundation (CNCF) Sandbox. The stack is Go on the back end, React and TypeScript on the front, and Helm for packaging. No team. Just me and two AI coding agents running in parallel terminal sessions.
The first two weeks were the honeymoon that everyone in this space seems to describe. Code came out of the agents faster than I could read it. Things I’d have budgeted three days for showed up in two hours. I kept a mental list of features I’d always wanted to build and just kept calling them off, one after another.
Then it struck.
Builds broke in ways that were hard to trace. Architectural choices from the day before quietly got overwritten. Scope expanded without being asked. The agent kept touching files I hadn’t pointed it toward, and the cascade problem was the worst of it—fix one thing, then three others broke. I started spending more time reverting than reviewing. The promised 10x started to feel like a net negative, and I decided to scrap the whole approach.
The surprise in building KubeStellar Console with coding agents was not the extent of the model’s capabilities, but the heavy lifting the surrounding codebase had to perform.
That arc, from euphoria to grinding frustration, is apparently universal. The usual industry advice is to hand the agent more autonomy: let it run longer, touch more files, and self-correct. In my experience, that tends to make the failure mode worse, not better. The leverage runs in the opposite direction. The intelligence in an AI-assisted codebase lives less in the model and more in the loops the codebase wraps around it. If you want the agent to do more, the surrounding code has to measure more.
Four months on, and KubeStellar Console is now in better shape. There are 63 CI/CD workflows, 32 nightly test suites, and coverage sitting at 91% across twelve shards. Across 82 days, PR acceptance settled around 81%. Community bug reports are moving to merged fixes in roughly thirty minutes. Feature requests are landing as pull requests in about an hour. None of that was the result of a better model. What changed was what the code itself had learned to measure.
Five tightening loops got me there. I think of them as the rungs of what I’ve been calling the AI Codebase Maturity Model—Assisted, Instructed, Measured, Adaptive, and Self-Sustaining. I’ll walk through them in the order they appeared, because I don’t think they can be reordered.
1. Write down what you keep correcting (instructed)
The cheapest intervention, and probably the highest return, is to externalize your own preferences. I started with a CLAUDE.md at the root of the repo, followed by a .github/copilot-instructions.md file for pull request conventions. Next came a card-level development guide that cataloged the top reasons I was rejecting AI-generated PRs.
That one guide wound up covering about 90% of my rejection criteria. Sessions became more consistent. The same mistakes stopped recurring across agents. I wouldn’t call this measurement — at this point, I was still running on intuition — but it filtered out enough noise for a standard measurement to become possible.
2. Treat tests as the trust layer, not just the correctness layer (measured)
This was the turn that mattered most. Testing for an autonomous workflow differs from testing for a human workflow. It’s the only signal the agent has to know whether it’s making the system better or worse.
Over four weeks, I added 32 nightly suites and pushed coverage to 91% across twelve parallel shards. The suites covered compliance, performance, nil safety, accessibility, internationalization, and visual regression. Alongside that, I started logging PR acceptance rates per category into auto-qa-tuning.json. That file turned out to be load-bearing for everything that followed.
Coverage volume matters. So does breadth. But the thing that nearly undid me, and that I’d flag hardest for anyone attempting this, is determinism.
“A flaky test in a human workflow is an annoyance. In an autonomous one, it’s a slow, quiet erosion of the entire trust model.”
One Playwright end-to-end test for drag-and-drop passed about 85% of the time. In a human workflow, that’s tolerable; you re-run it, you move on. In an autonomous workflow where test results gate merges, an 85% test is a disaster. Good PRs were being blocked at random, and weak ones were being let through. I spent three days on that single test, and it turned out to be an animation-completion timing issue in CI. The lesson generalized. You can’t build automation on top of an unreliable signal. A flaky test in a human workflow is an annoyance. In an autonomous one, it’s a slow, quiet erosion of the entire trust model.
3. Don’t automate until you can measure (adaptive)
With acceptance rates being logged, automation became a safer proposition. Auto-QA started running four times a day across eight layers of quality checks. The rotation weights that decide which categories of work the system focuses on began adjusting themselves based on the data. Accessibility PRs were landing at 62% acceptance, so their weight went up to 0.93. Operator-category PRs were landing at 8% (11 merges against 129 closed), so that weight dropped to zero and CI cycles got redirected.
A few more loops closed around that core:
- A triage process scanned four repositories every 15 minutes.
- A PR monitor polled build status every 60 seconds.
- An error-recovery workflow used exponential backoff to handle stuck agents.
- A GA4 query ran hourly against production analytics and filed GitHub issues for error spikes before users reported them.
“Automation without measurement isn’t maturity — it’s failure at scale.”
The pattern across all of these is the same: measurement first, automation second. Inverting the order is how autonomous systems go off the rails. Automation without measurement isn’t maturity — it’s failure at scale.
4. Let the codebase become the operating manual (self-sustaining)
At some point, and I can’t point to a specific day, the system stopped needing me in the loop to operate. Its behavior was being determined by its artifacts: the instruction files, the tests, the workflow rules, and the acceptance rate history. The community started opening issues at all hours, and those issues were being triaged, assigned, fixed, tested, and queued for review before I even woke up.
One case crystallized the shift. In April, a user filed a bug reporting that a cluster was marked “healthy” while pods were stuck in ImagePullBackOff. Before I looked at it, the system had already answered that cluster health reflects infrastructure health (node readiness, API reachability), which is architecturally separate from workload health. It wasn’t a bug. It was a Kubernetes mental model that didn’t quite map to what the dashboard was showing. The design decision was already encoded in the tests, in the health-check logic, and in the docs; the agent could explain it because the codebase already knew it.
That, more than any throughput number, is what “the code is the model” actually looks like in practice.
5. Ask “why,” not “what”
One prompting habit did disproportionate work. Instead of “fix this bug,” I started asking, “Why didn’t you catch this?” The first phrasing produces a patch. The second tends to produce a root-cause analysis and, as a side effect, a new test, instruction, or rule that blocks an entire class of similar failures.
Commanding gets you a sequence of isolated fixes. Questioning compounds. Over time, the questions are what turn the codebase into a self-improving system, and they’re what produce the instruction files in the first place if you’re starting from scratch.
What this might mean for maintainers and leaders
If you’re leading engineering, stop optimizing for which model you’re using. The model is a commodity component, and swapping one for another is a weekend of work. Rebuilding the surrounding feedback system is a quarter of the work. The differentiation is the intelligence infrastructure: the instruction files, the test suites, the metrics, and the workflow rules.
For open source maintainers, this directly addresses the burnout problem that keeps surfacing in CNCF community conversations. If a codebase can encode enough of a maintainer’s judgment that agents can handle triage, generate pull requests, and explain design decisions to users, then the community can steer the project primarily by filing issues.
Maintainers become architects of the system rather than its daily operators. That’s not hypothetical for KubeStellar Console. It’s working now. Whether it scales beyond a solo-maintained Sandbox project is something the broader community will need to test. I’d genuinely like to know.
Most teams are still in the first loop, writing prompts and reviewing output. That’s where everyone starts. The point isn’t to race to the last loop. The point is to notice which loop is actually blocking you and close that one next.
The codebase holds what I’ve learned. The tests catch what I can’t keep in my head. What’s still mine — and I think this part stays mine — is deciding what’s worth building, what to say no to, and what good is supposed to look like.
Kubernetes v1.36: Advancing Workload-Aware Scheduling
AI/ML and batch workloads introduce unique scheduling challenges that go beyond simple Pod-by-Pod scheduling. In Kubernetes v1.35, we introduced the first tranche of workload-aware scheduling improvements, featuring the foundational Workload API alongside basic gang scheduling support built on a Pod-based framework, and an opportunistic batching feature to efficiently process identical Pods.
Kubernetes v1.36 introduces a significant architectural evolution by cleanly separating API concerns:
the Workload API acts as a static template, while the new PodGroup API handles the runtime state.
To support this, the kube-scheduler features a new PodGroup scheduling cycle that enables atomic workload processing
and paves the way for future enhancements. This release also debuts the first iterations of topology-aware scheduling
and workload-aware preemption to advance scheduling capabilities. Additionally,
ResourceClaim support for workloads unlocks Dynamic Resource Allocation
(DRA) for PodGroups. Finally,
to demonstrate real-world readiness, v1.36 delivers the first phase of integration between the Job controller and the new API.
Workload and PodGroup API updates
The Workload API now serves as a static template, while the new PodGroup API describes the runtime object.
Kubernetes v1.36 introduces the Workload and PodGroup APIs as part of the
scheduling.k8s.io/v1alpha2 API group,
completely replacing the previous v1alpha1 API version.
In v1.35, Pod groups and their runtime states were embedded within the Workload resource. The new model decouples these concepts: the Workload now serves as a static template object, while the PodGroup manages the runtime state. This separation also improves performance and scalability as the PodGroup API allows per-replica sharding of status updates.
Because the Workload API acts merely as a template, the kube-scheduler's logic is streamlined.
The scheduler can directly read the PodGroup, which contains all the information required by the scheduler,
without needing to watch or parse the Workload object itself.
Here is what the updated configuration looks like. Workload controllers (such as the Job controller) define the Workload object, which now acts as a static template for your Pod groups:
apiVersion: scheduling.k8s.io/v1alpha2
kind: Workload
metadata:
 name: training-job-workload
 namespace: some-ns
spec:
 # Pod groups are now defined as templates,
 # which contains the PodGroup objects' spec fields.
 podGroupTemplates:
 - name: workers
 schedulingPolicy:
 gang:
 # The gang is schedulable only if 4 pods can run at once
 minCount: 4
Controllers then stamp out runtime PodGroup instances based on those templates. The PodGroup runtime object holds the actual scheduling policy and references the template from which it was created. It also has a status containing conditions that mirror the states of individual Pods, reflecting the overall scheduling state of the group:
apiVersion: scheduling.k8s.io/v1alpha2
kind: PodGroup
metadata:
 name: training-job-workers-pg
 namespace: some-ns
spec:
 # The PodGroup references the Workload template it originated from.
 # In comparison, .metadata.ownerReferences points to the "true" workload object,
 # e.g., a Job.
 podGroupTemplateRef:
 workload:
 workloadName: training-job-workload
 podGroupTemplateName: workers
 # The actual scheduling policy is placed inside the runtime PodGroup
 schedulingPolicy:
 gang:
 minCount: 4
status:
 # The status contains conditions mirroring individual Pod conditions.
 conditions:
 - type: PodGroupScheduled
 status: "True"
 lastTransitionTime: 2026-04-03T00:00:00Z
Finally, to bridge this new architecture with individual Pods, the workloadRef field in the Pod API has been replaced
with the schedulingGroup field. When creating Pods, you link them directly to the runtime PodGroup:
apiVersion: v1
kind: Pod
metadata:
 name: worker-0
 namespace: some-ns
spec:
 # The workloadRef field has been replaced by schedulingGroup
 schedulingGroup:
 podGroupName: training-job-workers-pg
 ...
By keeping the Workload as a static template and elevating the PodGroup to a first-class, standalone API, we establish a robust foundation for building advanced workload scheduling capabilities in future Kubernetes releases.
PodGroup scheduling cycle and gang scheduling
To efficiently manage these workloads, the kube-scheduler now features a dedicated PodGroup scheduling cycle. Instead of evaluating and reserving resources sequentially Pod-by-Pod, which risks scheduling deadlocks, the scheduler evaluates the group as a unified operation.
When the scheduler pops a PodGroup member from the scheduling queue, regardless of the group's specific policy, it fetches the rest of the queued Pods for that group, sorts them deterministically, and executes an atomic scheduling cycle as follows:
-
The scheduler takes a single snapshot of the cluster state to prevent race conditions and ensure consistency while evaluating the entire group.
-
It then attempts to find valid Node placements for all Pods in the group using a PodGroup scheduling algorithm, which leverages the standard Pod-based filtering and scoring phases.
-
Based on the algorithm's outcome, the scheduling decision is applied atomically for the entire PodGroup.
-
Success: If the placement is found and group constraints are met, the schedulable member Pods are moved directly to the binding phase together. Any remaining unschedulable Pods are returned to the scheduling queue to wait for available resources so they can join the already scheduled Pods.
(Note: If new Pods are added to a PodGroup after others are already scheduled, the cycle evaluates the new Pods while accounting for the existing ones. Crucially, Pods already assigned to Nodes remain running. The scheduler will not unassign or evict them, even if the group fails to meet its requirements in subsequent cycles.)
-
Failure: If the group fails to meet its requirements, the entire group is considered unschedulable. None of the Pods are bound, and they are returned to the scheduling queue to retry later after a backoff period.
-
This cycle acts as the foundation for gang scheduling. When your workload requires strict all-or-nothing placement,
the gang policy leverages this cycle to prevent partial deployments that lead to resource wastage and potential deadlocks.
While the scheduler still holds the Pods in the PreEnqueue until the minCount requirement is met, the actual scheduling phase now relies entirely
on the new PodGroup cycle. Specifically, during the algorithm's execution, the scheduler verifies
that the number of schedulable Pods satisfies the minCount. If the cluster cannot accommodate the required minimum,
none of the pods are bound. The group fails and waits for sufficient resources to free up.
Limitations
The first version of the PodGroup scheduling cycle comes with certain limitations:
-
For basic homogeneous Pod groups (i.e., those where all Pods have identical scheduling requirements and lack inter-Pod dependencies like affinity, anti-affinity, or topology spread constraints), the algorithm is expected to find a placement if one exists.
-
For heterogeneous Pod groups, finding a valid placement if one exists is not guaranteed, even when the solution might seem trivial.
-
For Pod groups with inter-Pod dependencies, finding a valid placement if one exists is not guaranteed.
In addition to the above, for cases involving intra-group dependencies (e.g., when the schedulability of one Pod depends on another group member via inter-Pod affinity), this algorithm may fail to find a placement regardless of cluster state due to its deterministic processing order.
Topology-aware scheduling
For complex distributed workloads like AI/ML training or batch processing, placing Pods randomly across a cluster can introduce significant network latency and bottleneck overall performance.
Topology-aware scheduling addresses this problem by allowing you to define topology constraints directly on a PodGroup, ensuring its Pods are co-located within specific physical or logical domains:
apiVersion: scheduling.k8s.io/v1alpha2
kind: PodGroup
metadata:
 name: topology-aware-workers-pg
spec:
 schedulingPolicy:
 gang:
 minCount: 4
 # Enforce that the pods are co-located based on the rack topology
 schedulingConstraints:
 topology:
 - key: topology.kubernetes.io/rack
In this example, the kube-scheduler attempts to schedule the Pods across various combinations of Nodes
that match the rack topology constraint. It then selects the optimal placement based on how efficiently
the PodGroup utilizes resources and how many Pods can successfully be scheduled within that domain.
To achieve this, the scheduler extends the PodGroup scheduling cycle with a dedicated placement-based algorithm consisting of three phases:
-
Generate candidate placements (subsets of Nodes that are theoretically feasible for the PodGroup's assignment) based on the group's scheduling constraints. The topology-aware scheduling plugin uses the new
PlacementGenerateextension point to create these placements. -
Evaluate each proposed placement to confirm whether the entire PodGroup can actually fit there.
-
Score all feasible placements to select the best fit for the PodGroup. The topology-aware scheduling plugins use the new
PlacementScoreextension point to score these placements.
Currently, topology-aware scheduling does not trigger Pod preemption to satisfy constraints. However, we plan to integrate workload-aware preemption with topology constraints in the upcoming release.
While Kubernetes v1.36 delivers this foundational topology-aware scheduling, the Kubernetes project is planning
expand its capabilities soon. Future updates will introduce support for multiple topology levels,
soft constraints (preferences), deeper integration with Dynamic Resource Allocation (DRA),
and more robust behavior when paired with the basic scheduling policy.
Workload-aware preemption
To support the new PodGroup scheduling cycle, Kubernetes v1.36 introduces a new type of preemption mechanism called workload-aware preemption. When a PodGroup cannot be scheduled, the scheduler utilizes this mechanism to try making a scheduling of this PodGroup possible.
Compared to the default preemption used in the standard Pod-by-Pod scheduling cycle, this new mechanism treats the entire PodGroup as a single preemptor unit. Instead of evaluating preemption victims on each Node separately, it searches across the entire cluster. This allows the scheduler to preempt Pods from multiple Nodes simultaneously, making enough space to schedule the whole PodGroup afterwards.
Workload-aware preemption also introduces two additional concepts directly to the PodGroup API:
-
PodGroup
prioritythat overrides the priority of the individual Pods forming the PodGroup. -
PodGroup
disruptionModethat dictates whether the Pods within a PodGroup can be preempted independently, or if they have to be preempted together in an all-or-nothing fashion.
In Kubernetes v1.36, these fields are only respected by the workload-aware preemption mechanism. The people working on this set of features are hoping to extend support for these fields to other disruption sources, including default preemption used in the Pod-by-Pod scheduling cycle, in future releases.
apiVersion: scheduling.k8s.io/v1alpha2
kind: PodGroup
metadata:
 name: victim-pg
spec:
 priorityClassName: high-priority
 priority: 1000
 disruptionMode: PodGroup
In this example, when the scheduler evaluates victim-pg as a potential preemption victim
during a workload-aware preemption cycle, it will use 1000 as its priority and preempt the PodGroup
in a strictly all-or-nothing fashion.
DRA ResourceClaim support for workloads
Since its general availability in Kubernetes v1.34, DRA has enabled Pods to make detailed requests for devices like GPUs, TPUs, and NICs. Requested devices can be shared by multiple Pods requesting the same ResourceClaim by name. Other requests can be replicated through a ResourceClaimTemplate, in which Kubernetes generates one ResourceClaim with a non-deterministic name for each Pod referencing the template. However, large-scale workloads that require certain Pods to share certain devices are currently left to manage creating individual ResourceClaims themselves.
Now, in addition to Pods, PodGroups can represent the replicable unit for a
ResourceClaimTemplate. For ResourceClaimTemplates referenced by one of a
PodGroup's spec.resourceClaims, Kubernetes generates one ResourceClaim for the
entire PodGroup, no matter how many Pods are in the group. When one of a Pod's
spec.resourceClaims for a ResourceClaimTemplate matches one of its PodGroup's
spec.resourceClaims, the Pod's claim resolves to the ResourceClaim generated
for the PodGroup and a ResourceClaim will not be generated for that individual
Pod. A single PodGroupTemplate in a Workload object can express resource
requests which are both copied for each distinct PodGroup and shareable by the
Pods within each group.
The following example shows two Pods requesting the same ResourceClaim generated from a ResourceClaimTemplate for their PodGroup:
apiVersion: scheduling.k8s.io/v1alpha2
kind: PodGroup
metadata:
 name: training-job-workers-pg
spec:
 ...
 resourceClaims:
 - name: pg-claim
 resourceClaimTemplateName: my-claim-template
---
apiVersion: v1
kind: Pod
metadata:
 name: topology-aware-workers-pg-pod-1
spec:
 ...
 schedulingGroup:
 podGroupName: training-job-workers-pg
 resourceClaims:
 - name: pg-claim
 resourceClaimTemplateName: my-claim-template
---
apiVersion: v1
kind: Pod
metadata:
 name: topology-aware-workers-pg-pod-2
spec:
 ...
 schedulingGroup:
 podGroupName: training-job-workers-pg
 resourceClaims:
 - name: pg-claim
 resourceClaimTemplateName: my-claim-template
In addition, ResourceClaims referenced by PodGroups, either through
resourceClaimName or the claim generated from resourceClaimTemplateName,
become reserved for the entire PodGroup. Previously, kube-scheduler could only
list individual Pods in a ResourceClaim's status.reservedFor field which is
limited to 256 items. Now, a single PodGroup reference in status.reservedFor
can represent many more than 256 Pods, allowing high-cardinality sharing of
devices.
Together, these changes enable massive workloads with complex topologies to utilize DRA for scalable device management.
Integration with the Job controller
In Kubernetes v1.36, the Job controller can create and manage Workload and PodGroup objects on your behalf, so that Jobs representing a tightly coupled parallel application, such as distributed AI training, are gang-scheduled without any additional tooling. Without this integration, you would have to create the Workload and PodGroup yourself and wire their references into the Pod template. Now, the Job controller automates this process natively.
When the WorkloadWithJob
feature gate is enabled, the Job controller automatically:
-
creates a Workload and a corresponding runtime PodGroup for each qualifying Job,
-
sets
.spec.schedulingGrouponto every Pod the Job creates so the scheduler treats them as a single gang, and -
sets the Job as the owner of the generated objects, so they are garbage-collected when the Job is deleted.
When does the integration kick in?
To keep the first feature iteration predictable, the Job controller only creates a Workload and PodGroup when the Job has a well-defined, fixed shape:
-
.spec.parallelismis greater than 1 -
.spec.completionModeis set toIndexed -
.spec.completionsis equal to.spec.parallelism -
The
schedulingGroupis not already set on the Pod template.
These conditions describe the class of Jobs that gang scheduling can reason about:
each Pod has a stable identity (Indexed), the gang size is known and fixed at admission time
(parallelism == completions), and no other controller has already claimed scheduling responsibility
(schedulingGroup field is unset). Jobs that do not meet these conditions are scheduled Pod-by-Pod,
exactly as before.
If you set schedulingGroup on the Pod template yourself (for example,
because a higher-level controller is managing the workload), the Job controller leaves
the Pod template alone and does not create its own Workload or PodGroup. This makes the feature
safe to enable in clusters that already use an external batch system.
Here is an example of a Job that qualifies for gang scheduling:
apiVersion: batch/v1
kind: Job
metadata:
 name: training-job
 namespace: job-ns
spec:
 completionMode: Indexed
 parallelism: 4
 completions: 4
 template:
 spec:
 restartPolicy: Never
 containers:
 - name: worker
 image: registry.example/trainer:latest
The Job controller creates a Workload and a PodGroup owned by this Job,
and every Pod it creates carries a .spec.schedulingGroup that points at the generated PodGroup.
The Pods are then scheduled together once all four can be placed at the same time using
the PodGroup scheduling cycle described earlier in this post.
What's not covered yet
The current constraints limit this integration to static, indexed, fully-parallel Jobs. Support for additional workload shapes, including elastic Jobs and other built-in controllers, is tracked in KEP-5547.
In future Kubernetes releases, this integration will expand to support additional workload controllers, and the current constraints for Jobs may be relaxed.
What's next?
The journey for workload-aware scheduling doesn't stop here. For v1.37, the community is actively working on:
-
Graduating Workload and PodGroup APIs to Beta: Our primary goal is to mature the Workload and PodGroup APIs to the Beta stage, solidifying their foundational role in the Kubernetes ecosystem. As part of this graduation process, we also plan to introduce
minCountmutability to unlock elastic jobs and allow dynamic workloads to scale efficiently. -
Multi-level Workload hierarchies: To support complex modern AI workloads like JobSet or Disaggregated Inference via LeaderWorkerSet (LWS), we are working on expanding the architecture to support multi-level hierarchies. We aim to introduce a new API that allows grouping multiple PodGroups into hierarchical structures, directly reflecting the organization of real-world workload controllers.
-
Graduating advanced scheduling features: We are focused on driving the maturity of the broader workload-aware scheduling ecosystem. This includes bringing existing features, such as topology-aware scheduling and workload-aware preemption, to the Beta stage.
-
Unified controller integration API: To streamline adoption, we’re working on a controller integration API. This will provide real-world workload controllers with a unified, standardized method for consuming workload-aware scheduling capabilities.
The priority and implementation order of these focus areas are subject to change. Stay tuned for further updates.
Getting started
All below workload-aware scheduling improvements are available as Alpha features in v1.36. To try them out, you must configure the following:
- Prerequisite: Workload and PodGroup API support: Enable the
GenericWorkloadfeature gate on both thekube-apiserverandkube-scheduler, and ensure thescheduling.k8s.io/v1alpha2API group is enabled.
Once the prerequisite is met, you can enable specific features:
- Gang scheduling: Enable the
GangSchedulingfeature gate on thekube-scheduler. - Topology-aware scheduling: Enable the
TopologyAwareWorkloadSchedulingfeature gate on thekube-scheduler. - Workload-aware preemption: Enable the
WorkloadAwarePreemptionfeature gate on thekube-scheduler(requiresGangSchedulingto also be enabled). - DRA ResourceClaim support for workloads: Enable the
DRAWorkloadResourceClaimsfeature gate on thekube-apiserver,kube-controller-manager,kube-schedulerandkubelet. - Workload API integration with the Job controller: Enable the
WorkloadWithJobfeature gate on thekube-apiserverandkube-controller-manager.
We encourage you to try out workload-aware scheduling in your test clusters and share your experiences to help shape the future of Kubernetes scheduling. You can send your feedback by:
- Reaching out via Slack (#workload-aware-scheduling).
- Joining the SIG Scheduling meetings.
- Filing a new issue in the Kubernetes repository.
Learn more
To dive deeper into the architecture and design of these features, read the KEPs:
Kubernetes v1.36: PSI Metrics for Kubernetes Graduates to GA
Since its original implementation in the Linux kernel in 2018, Pressure Stall Information (PSI) has provided users with the high-fidelity signals needed to identify resource saturation before it becomes an outage. Unlike traditional utilization metrics, PSI tells the story of tasks stalled and time lost, all in nicely-packaged percentages of time across the CPU, memory, and I/O.
With the recent release of Kubernetes v1.36, users across the ecosystem have a stable, reliable interface to observe resource contention at the node, pod, and container levels. In this post, we will dive into the improvements and performance testing that proved its readiness for production.
Beyond utilization: why PSI?
Monitoring CPU or memory usage alone can be misleading. A node may report XX% (below 100%) CPU utilization while certain tasks are experiencing severe latency due to scheduling delays. PSI fills this gap by providing:
- Cumulative Totals: Absolute time spent in a stalled state.
- Moving Averages: 10s, 60s, and 300s windows that allow operators to distinguish between transient spikes and sustained resource tension.
Proving stability: performance testing at scale
A common concern when graduating telemetry features is the resource overhead required to collect and serve the metrics. To address this, SIG Node conducted extensive performance validation on high-density workloads (80+ pods) across various machine types.
Our testing focused on two primary scenarios to isolate the impact of the Kubelet and kernel-level collection respectively:
- Kernel PSI ON / Kubelet Feature OFF vs Kernel PSI ON / Kubelet Feature ON (Kubelet overhead)
- Kernel PSI OFF / Kubelet Feature ON vs Kernel PSI ON / Kubelet Feature ON (Kernel overhead)
Scenario 1: The Kubelet Overhead
First, we looked at the kubelet usage on 4 core machines (Case 1). For these, the Linux kernel was already tracking pressure on both clusters by default(psi=1), but we toggled the KubeletPSI feature gate to see if the Kubelet actively querying and exposing these metrics impacted the resource usage. The synchronized bursts seen in the graph are practically identical in both magnitude and frequency, confirming that the Kubelet's collection logic is highly lightweight and blends seamlessly into standard housekeeping cycles. There is no issue about the feature affecting the pre-existing resource use, staying within the normal 0.1 cores or 2.5% of the total node capacity, and is therefore safe for production-scale deployments.

(Case 1) Kubelet CPU Usage Rate Comparison
Figure 2: Kubelet CPU Usage Rate Comparison.
Next, we evaluated the system overhead in the same run. As seen in the following graph, the System CPU usage lines for the Kubelet PSI-enabled (red) follows the same pattern as the Kubelet PSI-disabled (blue) clusters, with a slight expected increase from the baseline. This visualizes that once the OS is tracking PSI, at around 2.5 cores, the act of Kubernetes reading those cgroup metrics is negligible to performance.
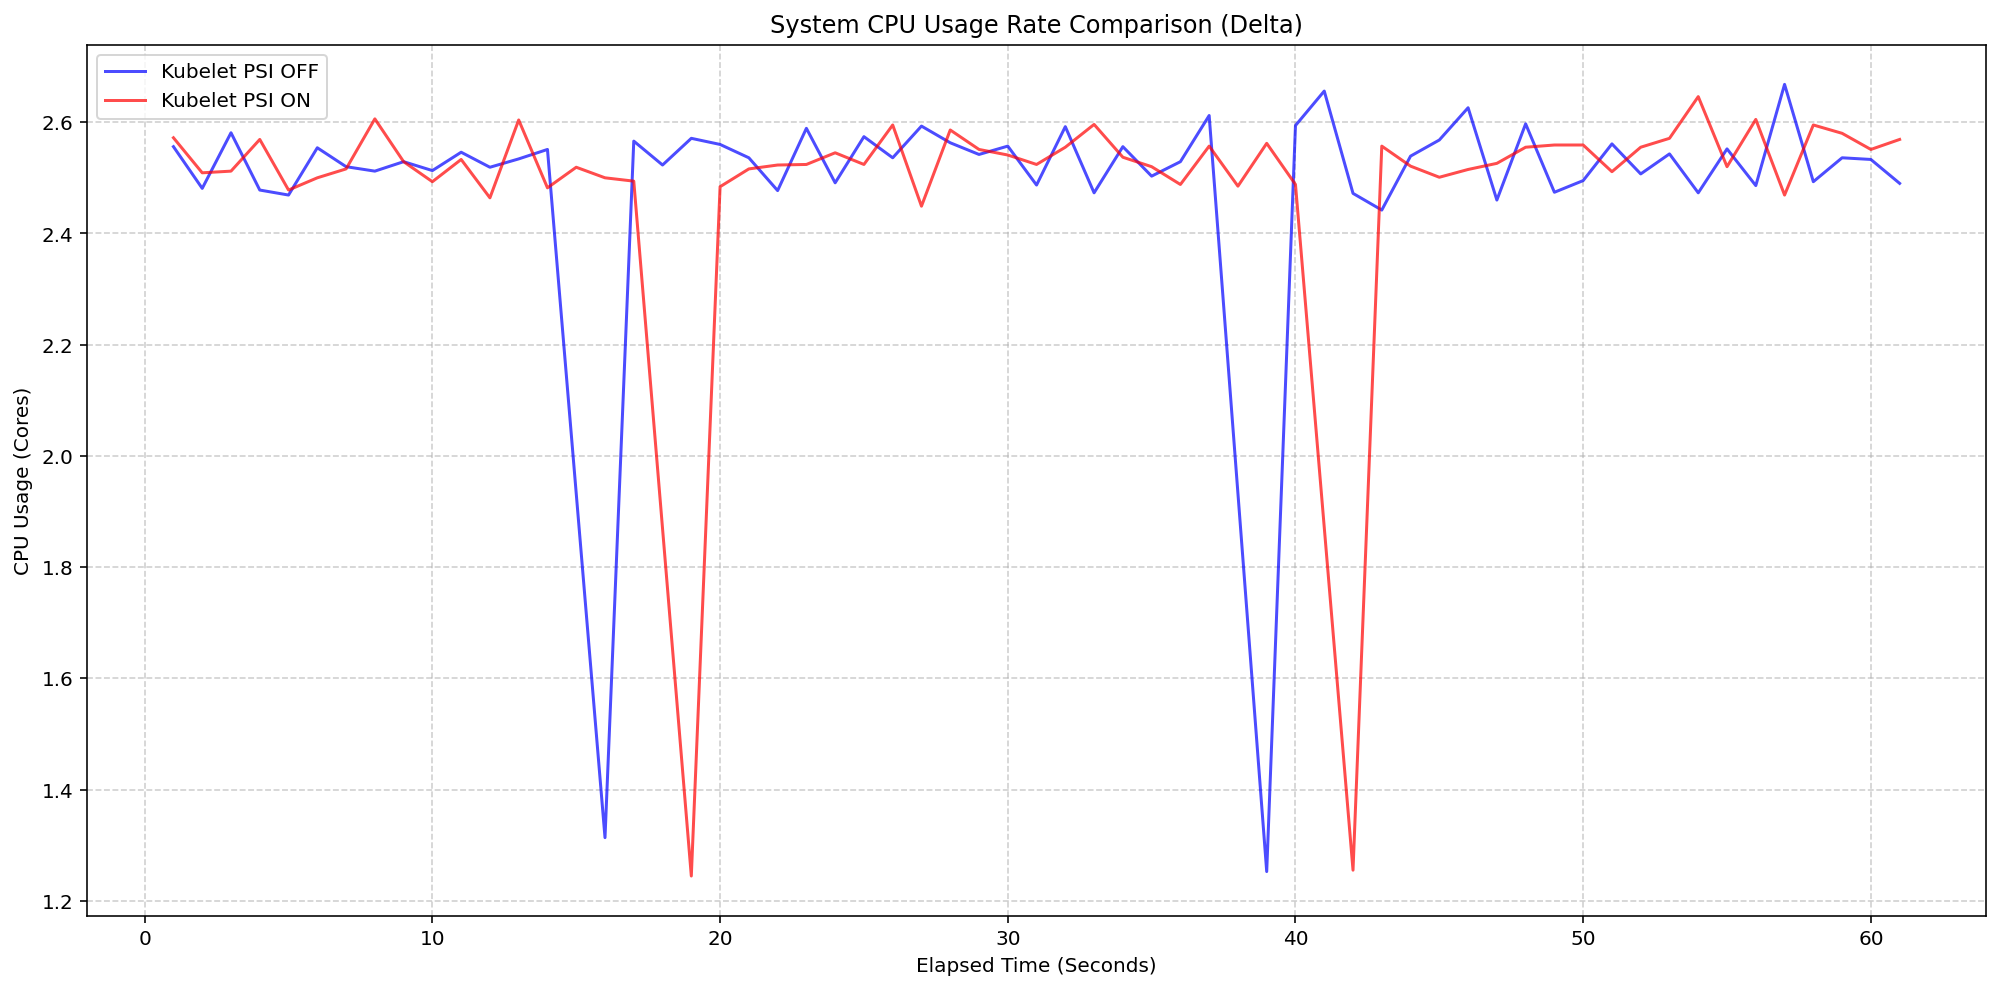
(Case 1) System CPU Usage Rate Comparison
Figure 1: Node System CPU Usage Rate Comparison.
Scenario 2: The Kernel Overhead
Shifting gears, we evaluated the underlying overhead of enabling PSI on the Linux kernel also on a 4 core machine. By comparing a cluster booted with psi=1 (COS default) against a cluster with psi=0, we isolated the exact cost of the OS-level bookkeeping. Even under heavy I/O and CPU load at an 80-pod density, the System CPU delta between the kernel-enabled and kernel-disabled clusters remained consistently between 0.037 cores and 0.125 cores or 0.925% - 3.125% of the total node capacity. There was a single spike to 0.225 cores, or 5.6%, but was controlled back down within a few seconds. This confirms that the internal kernel tracking is highly efficient under load.
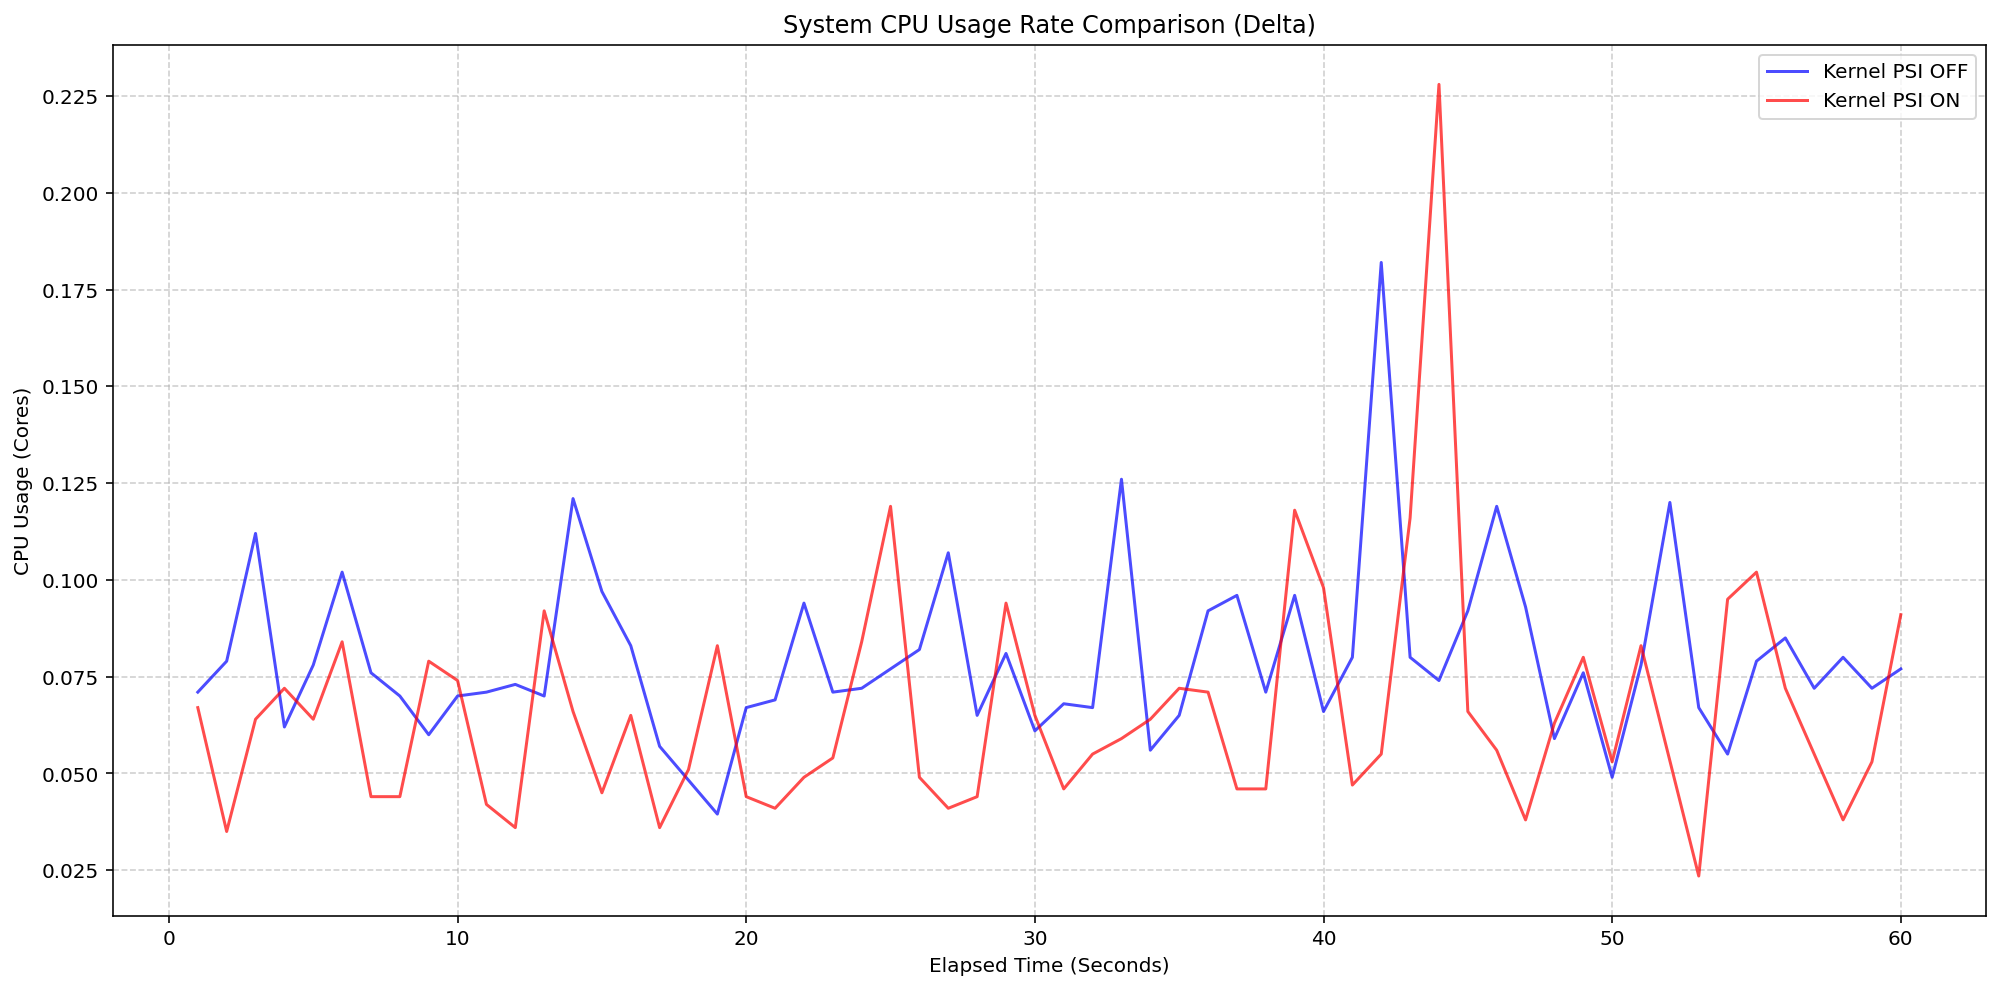
(Case 2) Node System CPU Usage Rate Comparison
Figure 3: Node System CPU Usage Rate Comparison.
Figure 4 zooms in on the kubelet process itself, which serves as the primary collector for these metrics. . The results show that even while the kubelet performs periodic sweeps to aggregate data from the cgroup hierarchy, its CPU usage remains remarkably low with interchangeable spikes and nothing exceeding 0.25 cores or 6.25% of total capacity for longer than a second.
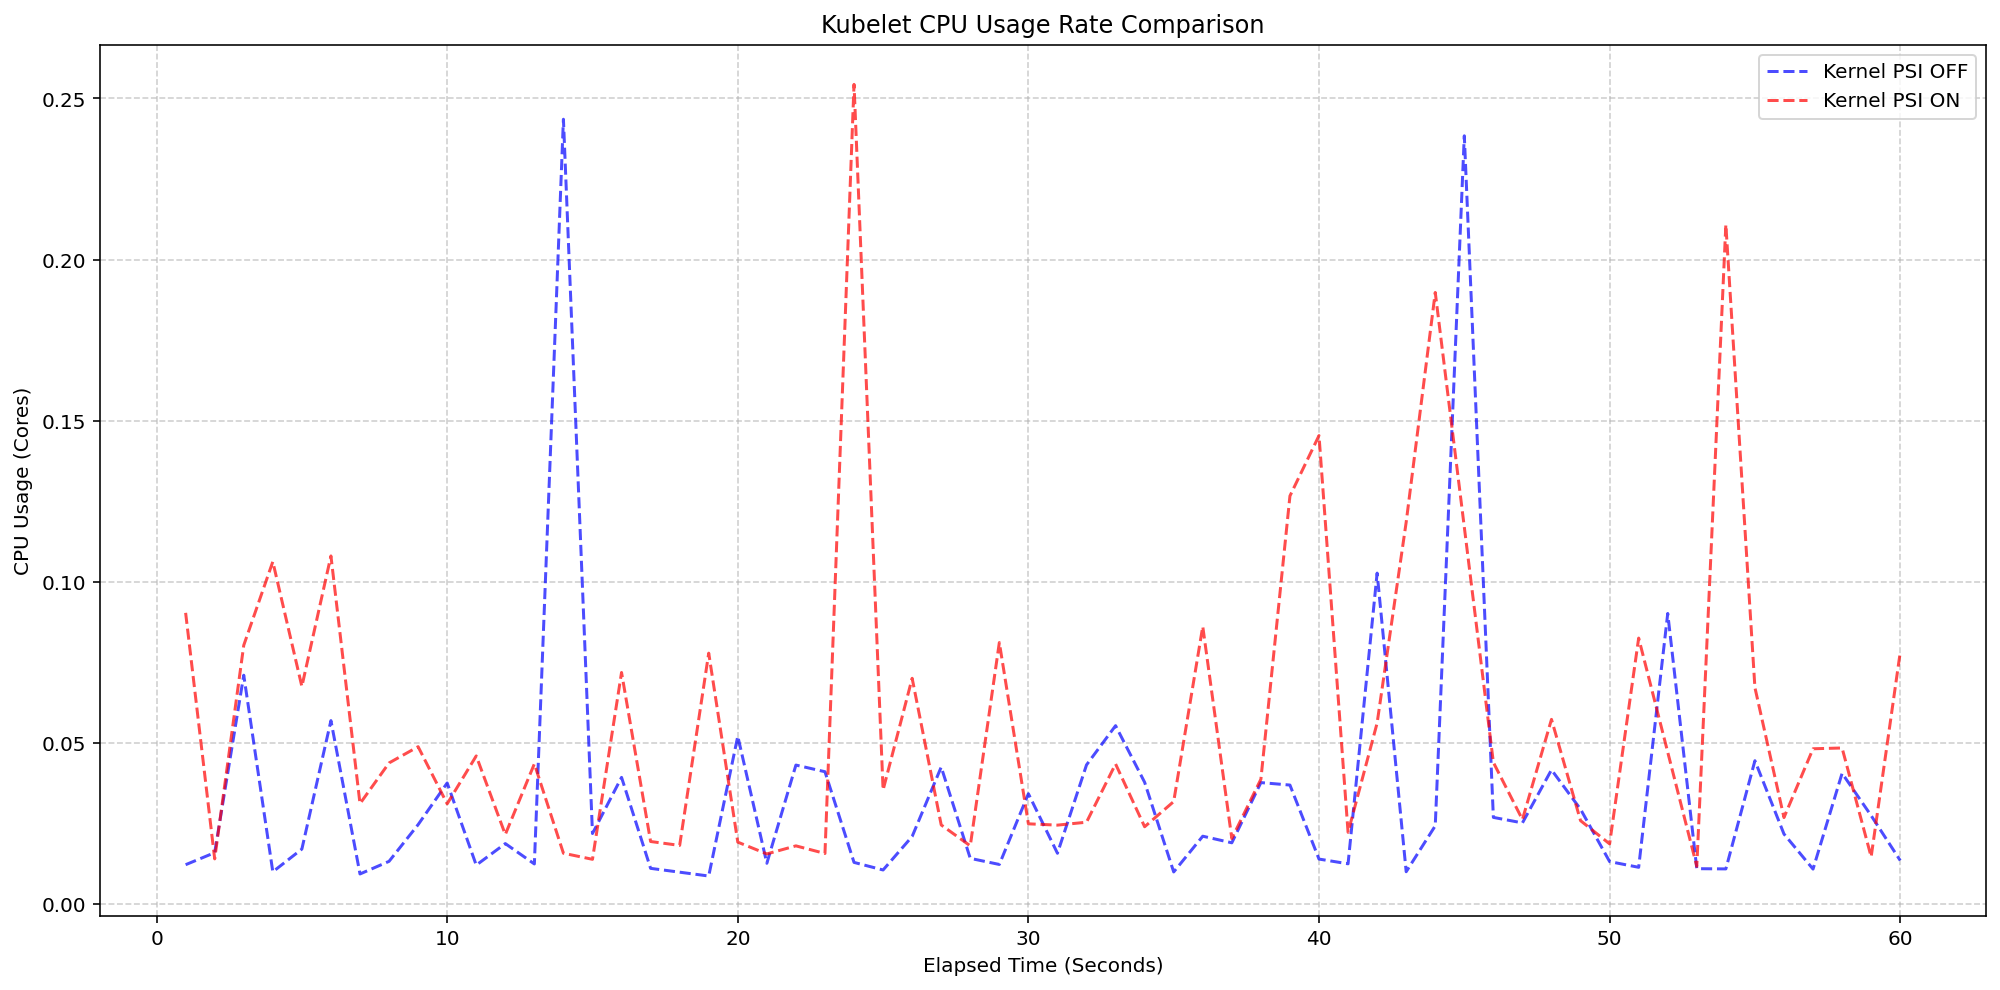
(Case 2) Kubelet CPU Usage Rate Comparison
Figure 4: Kubelet CPU Usage Rate Comparison.
Improvements between beta (1.34) and stable (1.36)
- Smarter Metric Emission for GA: We improved how the Kubelet handles underlying OS support for PSI. Previously, if the feature was enabled in Kubernetes but the underlying Linux kernel didn't support PSI (
psi=0), the Kubelet would emit misleading zero-valued metrics. These could trigger false alarms when read as real metrics instead of missing values. In v1.36, the Kubelet now detects OS-level PSI support via cgroup configurations before reporting. This ensures that pressure metrics are only collected and emitted when they are actually supported by the node, providing cleaner data for monitoring and alerting systems.
Getting started
To use PSI metrics in your Kubernetes cluster, your nodes must meet the following requirements:
- Ensure your nodes are running a Linux kernel version 4.20 or later and are using cgroup v2.
- Ensure PSI is enabled at the OS level (your kernel must be compiled with
CONFIG_PSI=yand must not be booted with thepsi=0parameter).
As of v1.36, Kubelet PSI metrics are generally available and you do not need to opt in to any feature gate.
Once the OS prerequisites are met, you can start scraping the /metrics/cadvisor endpoint with your Prometheus-compatible monitoring solution or query the Summary API to collect and visualize the new PSI metrics. Note that PSI is a Linux-kernel feature, so these metrics are not available on Windows nodes. Your cluster can contain a mix of Linux and Windows nodes, and on the Windows nodes, the kubelet will simply omit the PSI metrics.
If your cluster is running a recent enough version of Kubernetes and you are a privileged node administrator, you can also proxy to the kubelet's HTTP API via the control plane's API server to see real-time pressure data from the Summary API.
Caution: Proxying to the kubelet is a privileged operation. Granting access to it is a security risk, so ensure you have the appropriate administrative permissions before executing these commands.
CONTAINER_NAME="example-container"
kubectl get --raw "/api/v1/nodes/$(kubectl get nodes -o jsonpath='{.items[0].metadata.name}')/proxy/stats/summary" | jq '.pods[].containers[] | select(.name=="'"$CONTAINER_NAME"'") | {name, cpu: .cpu.psi, memory: .memory.psi, io: .io.psi}'
Further reading
If you want to dive deeper into how these metrics are calculated and exposed, check out these resources:
- The official Kernel documentation
- Understanding PSI in the Kubernetes documentation
- cAdvisor Metrics Implementation
Acknowledgements
Support for PSI metrics was developed through the collaborative efforts of SIG Node. Special thanks to all contributors who helped design, implement, test, review, and document this feature across its journey from alpha in v1.33, through beta in v1.34, to GA in v1.36.
To provide feedback on this feature, join the Kubernetes Node Special Interest Group, participate in discussions on the public Slack channel (#sig-node), or file an issue on GitHub.
Feedback
If you have feedback and want to share your experience using this feature, join the discussion:
- SIG Node community page
- Kubernetes Slack in the #sig-node channel
- SIG Node mailing list
SIG Node would love to hear about your experiences using this feature in production!
Kubernetes v1.36: PSI Metrics for Kubernetes Graduates to GA
Since its original implementation in the Linux kernel in 2018, Pressure Stall Information (PSI) has provided users with the high-fidelity signals needed to identify resource saturation before it becomes an outage. Unlike traditional utilization metrics, PSI tells the story of tasks stalled and time lost, all in nicely-packaged percentages of time across the CPU, memory, and I/O.
With the recent release of Kubernetes v1.36, users across the ecosystem have a stable, reliable interface to observe resource contention at the node, pod, and container levels. In this post, we will dive into the improvements and performance testing that proved its readiness for production.
Beyond utilization: why PSI?
Monitoring CPU or memory usage alone can be misleading. A node may report XX% (below 100%) CPU utilization while certain tasks are experiencing severe latency due to scheduling delays. PSI fills this gap by providing:
- Cumulative Totals: Absolute time spent in a stalled state.
- Moving Averages: 10s, 60s, and 300s windows that allow operators to distinguish between transient spikes and sustained resource tension.
Proving stability: performance testing at scale
A common concern when graduating telemetry features is the resource overhead required to collect and serve the metrics. To address this, SIG Node conducted extensive performance validation on high-density workloads (80+ pods) across various machine types.
Our testing focused on two primary scenarios to isolate the impact of the Kubelet and kernel-level collection respectively:
- Kernel PSI ON / Kubelet Feature OFF vs Kernel PSI ON / Kubelet Feature ON (Kubelet overhead)
- Kernel PSI OFF / Kubelet Feature ON vs Kernel PSI ON / Kubelet Feature ON (Kernel overhead)
Scenario 1: The Kubelet Overhead
First, we looked at the kubelet usage on 4 core machines (Case 1). For these, the Linux kernel was already tracking pressure on both clusters by default(psi=1), but we toggled the KubeletPSI feature gate to see if the Kubelet actively querying and exposing these metrics impacted the resource usage. The synchronized bursts seen in the graph are practically identical in both magnitude and frequency, confirming that the Kubelet's collection logic is highly lightweight and blends seamlessly into standard housekeeping cycles. There is no issue about the feature affecting the pre-existing resource use, staying within the normal 0.1 cores or 2.5% of the total node capacity, and is therefore safe for production-scale deployments.
(Case 1) Kubelet CPU Usage Rate Comparison
Figure 2: Kubelet CPU Usage Rate Comparison.
Next, we evaluated the system overhead in the same run. As seen in the following graph, the System CPU usage lines for the Kubelet PSI-enabled (red) follows the same pattern as the Kubelet PSI-disabled (blue) clusters, with a slight expected increase from the baseline. This visualizes that once the OS is tracking PSI, at around 2.5 cores, the act of Kubernetes reading those cgroup metrics is negligible to performance.
(Case 1) System CPU Usage Rate Comparison
Figure 1: Node System CPU Usage Rate Comparison.
Scenario 2: The Kernel Overhead
Shifting gears, we evaluated the underlying overhead of enabling PSI on the Linux kernel also on a 4 core machine. By comparing a cluster booted with psi=1 (COS default) against a cluster with psi=0, we isolated the exact cost of the OS-level bookkeeping. Even under heavy I/O and CPU load at an 80-pod density, the System CPU delta between the kernel-enabled and kernel-disabled clusters remained consistently between 0.037 cores and 0.125 cores or 0.925% - 3.125% of the total node capacity. There was a single spike to 0.225 cores, or 5.6%, but was controlled back down within a few seconds. This confirms that the internal kernel tracking is highly efficient under load.
(Case 2) Node System CPU Usage Rate Comparison
Figure 3: Node System CPU Usage Rate Comparison.
Figure 4 zooms in on the kubelet process itself, which serves as the primary collector for these metrics. . The results show that even while the kubelet performs periodic sweeps to aggregate data from the cgroup hierarchy, its CPU usage remains remarkably low with interchangeable spikes and nothing exceeding 0.25 cores or 6.25% of total capacity for longer than a second.
(Case 2) Kubelet CPU Usage Rate Comparison
Figure 4: Kubelet CPU Usage Rate Comparison.
Improvements between beta (1.34) and stable (1.36)
- Smarter Metric Emission for GA: We improved how the Kubelet handles underlying OS support for PSI. Previously, if the feature was enabled in Kubernetes but the underlying Linux kernel didn't support PSI (
psi=0), the Kubelet would emit misleading zero-valued metrics. These could trigger false alarms when read as real metrics instead of missing values. In v1.36, the Kubelet now detects OS-level PSI support via cgroup configurations before reporting. This ensures that pressure metrics are only collected and emitted when they are actually supported by the node, providing cleaner data for monitoring and alerting systems.
Getting started
To use PSI metrics in your Kubernetes cluster, your nodes must meet the following requirements:
- Ensure your nodes are running a Linux kernel version 4.20 or later and are using cgroup v2.
- Ensure PSI is enabled at the OS level (your kernel must be compiled with
CONFIG_PSI=yand must not be booted with thepsi=0parameter).
As of v1.36, Kubelet PSI metrics are generally available and you do not need to opt in to any feature gate.
Once the OS prerequisites are met, you can start scraping the /metrics/cadvisor endpoint with your Prometheus-compatible monitoring solution or query the Summary API to collect and visualize the new PSI metrics. Note that PSI is a Linux-kernel feature, so these metrics are not available on Windows nodes. Your cluster can contain a mix of Linux and Windows nodes, and on the Windows nodes, the kubelet will simply omit the PSI metrics.
If your cluster is running a recent enough version of Kubernetes and you are a privileged node administrator, you can also proxy to the kubelet's HTTP API via the control plane's API server to see real-time pressure data from the Summary API.
Caution: Proxying to the kubelet is a privileged operation. Granting access to it is a security risk, so ensure you have the appropriate administrative permissions before executing these commands.
CONTAINER_NAME="example-container"
kubectl get --raw "/api/v1/nodes/$(kubectl get nodes -o jsonpath='{.items[0].metadata.name}')/proxy/stats/summary" | jq '.pods[].containers[] | select(.name=="'"$CONTAINER_NAME"'") | {name, cpu: .cpu.psi, memory: .memory.psi, io: .io.psi}'
Further reading
If you want to dive deeper into how these metrics are calculated and exposed, check out these resources:
- The official Kernel documentation
- Understanding PSI in the Kubernetes documentation
- cAdvisor Metrics Implementation
Acknowledgements
Support for PSI metrics was developed through the collaborative efforts of SIG Node. Special thanks to all contributors who helped design, implement, test, review, and document this feature across its journey from alpha in v1.33, through beta in v1.34, to GA in v1.36.
To provide feedback on this feature, join the Kubernetes Node Special Interest Group, participate in discussions on the public Slack channel (#sig-node), or file an issue on GitHub.
Feedback
If you have feedback and want to share your experience using this feature, join the discussion:
- SIG Node community page
- Kubernetes Slack in the #sig-node channel
- SIG Node mailing list
SIG Node would love to hear about your experiences using this feature in production!