CNCF Blog Projects Category
Inspektor Gadget: Results from the first security audit
Inspektor Gadget, the open source eBPF-based toolkit for Kubernetes observability and Linux host inspection, has completed its first independent security audit. The audit was coordinated by the Open Source Technology Improvement Fund (OSTIF), funded by the CNCF and carried out by Shielder. The findings, the fixes, and the hardening recommendations are now public, and every reported vulnerability has a patch available.
This post walks through what Inspektor Gadget does, how the audit was scoped, what the researchers found, and what the results mean for teams running it in production.
What is Inspektor Gadget?
Inspektor Gadget is a framework and toolkit that uses eBPF to collect and inspect data on Kubernetes clusters and Linux hosts. It manages the packaging, deployment, and execution of “gadgets” — eBPF programs packaged as OCI images. OCI (the Open Container Initiative) is a Linux Foundation project that defines open industry standards for container image formats and runtimes, so the same image can be distributed and run across any compliant tool or registry.
For teams running Kubernetes in production that need to understand what is happening inside a cluster, Inspektor Gadget provides that visibility without the usual tradeoffs. There is no need to rebuild container images with extra instrumentation, inject sidecars into every pod, attach debuggers or strace to running processes, restart workloads to toggle tracing on and off, or ship custom kernel modules to nodes. Instead, eBPF programs are loaded into the kernel at runtime to safely observe syscalls, network activity, and file access. Applications keep running unchanged while operators get the data they need.
Why a security audit?
Any tool that runs with elevated privileges on shared infrastructure needs to earn trust. Inspektor Gadget runs with root-level access on nodes to do its job, so an independent review of its security posture is a natural step as the project matures and adoption grows.
OSTIF is a nonprofit dedicated to improving the security of open source software. Over the past ten years, OSTIF has managed security engagements that have uncovered more than 800 vulnerabilities across 120 open source projects.
How the audit was scoped
OSTIF engaged Shielder (add link), to perform the assessment. Two researchers worked on the audit in early 2026. Their methodology combined:
- Collaborative threat modeling with the Inspektor Gadget maintainers
- Manual source code review
- Dynamic testing on dedicated lab environments
- Static analysis using tools such as Semgrep and GoSec
- AI-assisted code review for broader coverage
The researchers built three test environments that reflect how Inspektor Gadget is deployed in the wild: a local Linux host deployment, a remote daemon deployment, and a Kubernetes deployment on minikube.
What the audit found
The audit identified three vulnerabilities. None were rated Critical or High severity.
Two Medium severity findings
- Command injection in ig image build (CVE-2026-24905). The image build process used Makefiles that embedded user-controlled input without proper escaping, creating a command injection vector. This matters most in CI/CD pipelines that build untrusted gadgets. Fixed in release v0.48.1.
- Denial of service via event flooding. A malicious container could flood the eBPF ring buffer (hard-coded to 256 KB), causing the system to silently drop events from other containers. For teams using Inspektor Gadget as part of a security monitoring pipeline, this could allow an attacker to hide activity by generating noise. Fixed in release v0.50.1.
One Low severity finding
- Unsanitized ANSI escape sequences in columns output mode (CVE-2026-25996). When rendering events in the terminal, Inspektor Gadget did not sanitize ANSI escape sequences, allowing a compromised container to inject terminal escape codes into an operator’s display. Fixed in release v0.49.1.
Hardening recommendations
Beyond the specific vulnerabilities, Shielder delivered six hardening recommendations. These are not active exploits — they are areas where the project can reduce its attack surface over time:
- Enforce TLS by default on TCP listeners. When the daemon starts a TCP listener without TLS, it currently logs a warning and continues in plaintext. The recommendation is to require an explicit opt-out flag.
- Pin and verify external dependencies in CI/CD. Several build dependencies were downloaded without hash or signature verification. The project has already landed fixes or has pull requests open for most of these.
- Implement a Kubernetes namespace blocklist to prevent unintended tracing on sensitive namespaces such as kube-system.
- Restrict remote clients from enabling host-level tracing through the daemon, or clearly document the risk.
- Automate third-party vulnerability scanning for project dependencies.
- Reduce RBAC permissions on the DaemonSet pod — specifically the nodes/proxy GET permission, which could be leveraged for privilege escalation if the service account token is compromised.
The maintainers are working through these systematically. Some are already merged; others, notably the RBAC refactor and namespace blocklist, will take more time.
Gadget bypass testing
One of the most technically interesting parts of the audit was the gadget bypass testing. The researchers asked: can a compromised container perform operations that a gadget is meant to trace, without triggering any events? They identified six bypass scenarios, ranging from using newer Linux syscalls that certain gadgets don’t hook (for example, openat2 instead of openat) to evasion through io_uring and statically linked libraries.
These results reflect the cat-and-mouse nature of kernel-level tracing. Linux keeps evolving, new syscalls and subsystems keep appearing, and eBPF-based tracing tools have to keep up. The Inspektor Gadget maintainers have already addressed several of the identified gaps and are documenting the inherent limitations of the approach so operators understand what eBPF tracing can and cannot guarantee.
What this means for users
The actionable step for organizations running Inspektor Gadget is to update to v0.50.1 or later, which includes fixes for all three reported vulnerabilities. Shielder’s own conclusion, from the final report, is that “the overall security posture of Inspektor Gadget is adequately mature from both a secure coding and design point of view.”
For the wider cloud native community, this audit is an example of how the ecosystem is supposed to work. A project reaches a level of adoption where independent security review becomes necessary, OSTIF coordinates a qualified engagement, researchers do the work in the open, maintainers land the fixes, and the full report is published so users can make informed decisions.
Resources
- Inspektor Gadget on GitHub
- Inspektor Gadget release v0.50.1
- OSTIF (Open Source Technology Improvement Fund)
- Shielder
Audit announcement and resources
- Full Report – Downloadable PDF
- Blog post – Inspektor Gadget
- Blog post – OSTIF
- Blog post – Shielder
- Blog post – Microsoft
CVEs
When AI agents become contributors: How KubeStellar reached 81% PR acceptance
In mid-December, I started building KubeStellar Console from scratch. It’s a multi-cluster management dashboard for Kubernetes, and it sits inside the KubeStellar project in the Cloud Native Computing Foundation (CNCF) Sandbox. The stack is Go on the back end, React and TypeScript on the front, and Helm for packaging. No team. Just me and two AI coding agents running in parallel terminal sessions.
The first two weeks were the honeymoon that everyone in this space seems to describe. Code came out of the agents faster than I could read it. Things I’d have budgeted three days for showed up in two hours. I kept a mental list of features I’d always wanted to build and just kept calling them off, one after another.
Then it struck.
Builds broke in ways that were hard to trace. Architectural choices from the day before quietly got overwritten. Scope expanded without being asked. The agent kept touching files I hadn’t pointed it toward, and the cascade problem was the worst of it—fix one thing, then three others broke. I started spending more time reverting than reviewing. The promised 10x started to feel like a net negative, and I decided to scrap the whole approach.
The surprise in building KubeStellar Console with coding agents was not the extent of the model’s capabilities, but the heavy lifting the surrounding codebase had to perform.
That arc, from euphoria to grinding frustration, is apparently universal. The usual industry advice is to hand the agent more autonomy: let it run longer, touch more files, and self-correct. In my experience, that tends to make the failure mode worse, not better. The leverage runs in the opposite direction. The intelligence in an AI-assisted codebase lives less in the model and more in the loops the codebase wraps around it. If you want the agent to do more, the surrounding code has to measure more.
Four months on, and KubeStellar Console is now in better shape. There are 63 CI/CD workflows, 32 nightly test suites, and coverage sitting at 91% across twelve shards. Across 82 days, PR acceptance settled around 81%. Community bug reports are moving to merged fixes in roughly thirty minutes. Feature requests are landing as pull requests in about an hour. None of that was the result of a better model. What changed was what the code itself had learned to measure.
Five tightening loops got me there. I think of them as the rungs of what I’ve been calling the AI Codebase Maturity Model—Assisted, Instructed, Measured, Adaptive, and Self-Sustaining. I’ll walk through them in the order they appeared, because I don’t think they can be reordered.
1. Write down what you keep correcting (instructed)
The cheapest intervention, and probably the highest return, is to externalize your own preferences. I started with a CLAUDE.md at the root of the repo, followed by a .github/copilot-instructions.md file for pull request conventions. Next came a card-level development guide that cataloged the top reasons I was rejecting AI-generated PRs.
That one guide wound up covering about 90% of my rejection criteria. Sessions became more consistent. The same mistakes stopped recurring across agents. I wouldn’t call this measurement — at this point, I was still running on intuition — but it filtered out enough noise for a standard measurement to become possible.
2. Treat tests as the trust layer, not just the correctness layer (measured)
This was the turn that mattered most. Testing for an autonomous workflow differs from testing for a human workflow. It’s the only signal the agent has to know whether it’s making the system better or worse.
Over four weeks, I added 32 nightly suites and pushed coverage to 91% across twelve parallel shards. The suites covered compliance, performance, nil safety, accessibility, internationalization, and visual regression. Alongside that, I started logging PR acceptance rates per category into auto-qa-tuning.json. That file turned out to be load-bearing for everything that followed.
Coverage volume matters. So does breadth. But the thing that nearly undid me, and that I’d flag hardest for anyone attempting this, is determinism.
“A flaky test in a human workflow is an annoyance. In an autonomous one, it’s a slow, quiet erosion of the entire trust model.”
One Playwright end-to-end test for drag-and-drop passed about 85% of the time. In a human workflow, that’s tolerable; you re-run it, you move on. In an autonomous workflow where test results gate merges, an 85% test is a disaster. Good PRs were being blocked at random, and weak ones were being let through. I spent three days on that single test, and it turned out to be an animation-completion timing issue in CI. The lesson generalized. You can’t build automation on top of an unreliable signal. A flaky test in a human workflow is an annoyance. In an autonomous one, it’s a slow, quiet erosion of the entire trust model.
3. Don’t automate until you can measure (adaptive)
With acceptance rates being logged, automation became a safer proposition. Auto-QA started running four times a day across eight layers of quality checks. The rotation weights that decide which categories of work the system focuses on began adjusting themselves based on the data. Accessibility PRs were landing at 62% acceptance, so their weight went up to 0.93. Operator-category PRs were landing at 8% (11 merges against 129 closed), so that weight dropped to zero and CI cycles got redirected.
A few more loops closed around that core:
- A triage process scanned four repositories every 15 minutes.
- A PR monitor polled build status every 60 seconds.
- An error-recovery workflow used exponential backoff to handle stuck agents.
- A GA4 query ran hourly against production analytics and filed GitHub issues for error spikes before users reported them.
“Automation without measurement isn’t maturity — it’s failure at scale.”
The pattern across all of these is the same: measurement first, automation second. Inverting the order is how autonomous systems go off the rails. Automation without measurement isn’t maturity — it’s failure at scale.
4. Let the codebase become the operating manual (self-sustaining)
At some point, and I can’t point to a specific day, the system stopped needing me in the loop to operate. Its behavior was being determined by its artifacts: the instruction files, the tests, the workflow rules, and the acceptance rate history. The community started opening issues at all hours, and those issues were being triaged, assigned, fixed, tested, and queued for review before I even woke up.
One case crystallized the shift. In April, a user filed a bug reporting that a cluster was marked “healthy” while pods were stuck in ImagePullBackOff. Before I looked at it, the system had already answered that cluster health reflects infrastructure health (node readiness, API reachability), which is architecturally separate from workload health. It wasn’t a bug. It was a Kubernetes mental model that didn’t quite map to what the dashboard was showing. The design decision was already encoded in the tests, in the health-check logic, and in the docs; the agent could explain it because the codebase already knew it.
That, more than any throughput number, is what “the code is the model” actually looks like in practice.
5. Ask “why,” not “what”
One prompting habit did disproportionate work. Instead of “fix this bug,” I started asking, “Why didn’t you catch this?” The first phrasing produces a patch. The second tends to produce a root-cause analysis and, as a side effect, a new test, instruction, or rule that blocks an entire class of similar failures.
Commanding gets you a sequence of isolated fixes. Questioning compounds. Over time, the questions are what turn the codebase into a self-improving system, and they’re what produce the instruction files in the first place if you’re starting from scratch.
What this might mean for maintainers and leaders
If you’re leading engineering, stop optimizing for which model you’re using. The model is a commodity component, and swapping one for another is a weekend of work. Rebuilding the surrounding feedback system is a quarter of the work. The differentiation is the intelligence infrastructure: the instruction files, the test suites, the metrics, and the workflow rules.
For open source maintainers, this directly addresses the burnout problem that keeps surfacing in CNCF community conversations. If a codebase can encode enough of a maintainer’s judgment that agents can handle triage, generate pull requests, and explain design decisions to users, then the community can steer the project primarily by filing issues.
Maintainers become architects of the system rather than its daily operators. That’s not hypothetical for KubeStellar Console. It’s working now. Whether it scales beyond a solo-maintained Sandbox project is something the broader community will need to test. I’d genuinely like to know.
Most teams are still in the first loop, writing prompts and reviewing output. That’s where everyone starts. The point isn’t to race to the last loop. The point is to notice which loop is actually blocking you and close that one next.
The codebase holds what I’ve learned. The tests catch what I can’t keep in my head. What’s still mine — and I think this part stays mine — is deciding what’s worth building, what to say no to, and what good is supposed to look like.
A decade of governance: Cloud Custodian at 10 and its role in the agentic AI era
What is Cloud Custodian? It is an open source, stateless policy engine used to manage public cloud environments, Kubernetes and infrastructure as code through a unified DSL. As an incubating project within CNCF, it allows organizations to define and enforce policies for FinOps, security, and compliance across multiple providers.
Why the 10th anniversary of Cloud Custodian matters now
Reaching a 10-year milestone is significant because Cloud Custodian has transitioned from a cloud management tool into a fundamental cost optimization and safety layer for the AI era. With the rise of agentic AI, where autonomous agents generate and deploy infrastructure code, real-time automated governance has become a necessity. Beyond agentic code, AI workloads like GPU fleets, model serving endpoints, and training pipelines introduce both a larger security attack surface and significantly higher cost exposure, where the risk of ungoverned resources is higher than ever.
Why Cloud Custodian is essential for AI governance
- Automated Guardrails: Cloud Custodian provides the structured, programmable boundaries required when AI agents manage infrastructure. and when high-cost AI workloads like GPU fleets and model serving endpoints are provisioned.
- Real-time enforcement: It closes cost and security risk windows by enforcing organizational and industry best practices as soon as AI-generated resources are deployed.
- Vendor neutrality: The project ensures consistent governance across AWS, Azure, GCP, Oracle Cloud, Kubernetes and Terraform preventing fragmented cost or security postures in complex AI workflows.
Reaching ten years is a testament to the community of maintainers and contributors who have built Cloud Custodian into a foundational tool for cloud governance as code. As we move into an era of AI-driven automation, the project’s ability to provide transparent, programmable guardrails ensures that even when code is generated by a machine, it adheres to human-defined standards of safety and efficiency.
How Cloud Custodian empowers the cloud native ecosystem
Cloud Custodian aligns with CNCF principles by focusing on declarative automation and community-led innovation.
- Declarative policy: Users describe the desired state of their cloud resources, and the engine handles enforcement.
- Action and remediation: Beyond detection, Cloud Custodian is built to fix and prevent issues through customizable remediation workflows — critical at the speed and complexity of AI-scale environments.
- Scalability: Designed for high-velocity environments, it manages thousands of resources without the overhead of stateful management.
- Proven reliability: A decade of production use has resulted in a robust library of thousands of community-vetted policy actions and filters.
Frequently asked questions about Cloud Custodian
How does Cloud Custodian help with cost management?
It uses policies to reduce waste by eliminating idle or underprovisioned resources, including idle training jobs and GPU fleets. It also prevents costly misconfigurations such as oversized storage tiers, ensuring cloud environments stay efficient and well-governed.
Is Cloud Custodian compatible with multiple clouds?
Yes, it provides a unified DSL to manage resources across AWS, Azure, GCP, and OCI , ensuring a single source of truth for organizational policy.
Why is Cloud Custodian relevant for AI-generated code?
AI agents can ship code faster than humans can review it. Cloud Custodian acts as an automated safety net, ensuring all machine-deployed infrastructure follows security and compliance rules while catching costly misconfigurations before they become security gaps or budget overruns.
Next steps for the community
To celebrate this milestone and explore how Cloud Custodian is adapting to the latest industry shifts, we encourage the community to engage with the following resources:
- Read the full announcement: An Open Source Project Turns 10 and Finds Itself Tailor-Made for the Agentic AI Era
- View the documentation: Visit cloudcustodian.io for technical guides.
- Contribute: Join the maintainers and contributors at the Cloud Custodian GitHub repository.
Congratulations to the contributors who have made the last decade possible. Here is to ten years of governance and the road ahead.
Microcks becomes a CNCF incubating project
The CNCF Technical Oversight Committee (TOC) has voted to accept Microcks as a CNCF incubating project.
About Microcks
Modern software teams build applications as collections of interconnected APIs and microservices, and with that architecture comes a significant challenge: how do you develop and test services in isolation when so many depend on each other? Microcks solves this by providing an open source, cloud native platform for API mocking and testing.
With Microcks, teams can instantly turn their existing API contract documents, whether they’re OpenAPI specs, AsyncAPI specs, gRPC/Protobuf definitions, GraphQL schemas, Postman collections, or SOAP/WSDL projects, into live mock servers. Those same assets then power automated contract conformance tests against real implementations. The result is a unified, multi-protocol approach that spans both synchronous REST/RPC APIs and event-driven, asynchronous architectures — a combination that sets Microcks apart from narrower tooling.
Microcks’s key milestones and ecosystem development
Created in February 2015 by Laurent Broudoux, Microcks is a community-driven project with global contributors and adopters, including financial institutions (BNP Paribas, Société Générale, and Lombard Odier) and technology/consulting firms (Deloitte, Amway, and J.B. Hunt).
Since joining the CNCF Sandbox on June 22, 2023, Microcks has seen significant growth in adoption, contribution, development, and ecosystem reach.
Adoption has surged, with container image downloads exceeding 2.5 million in 2025 (triple the 2024 total). Over 34 organizations publicly adopt Microcks, with 13 added in 2025 alone. The project has high community interest, evidenced by 1,800 GitHub stars and 311 forks on the main repository, plus consistent documentation traffic growth.
The contributor base is expanding, totaling 645 across GitHub. The last quarter saw 51 active contributors with an “Excellent” 57% quarter-over-quarter retention rate. In 2025, 167 active contributors represented 35 organizations. Maintainers now include code owners from Yosemite Crew and AXA France, signaling growing community ownership.
Development health is strong: the project was active 342 of the last 365 days. The 12-month average is 288 new pull requests monthly, with an average issue resolution time of 11 days and PR merge lead time of 6 days. The core platform has had 19 releases, with the current stable version being 1.14.0.
Post-sandbox, Microcks has deepened integrations with CNCF projects like Dapr, OpenTelemetry, Keycloak, and AsyncAPI (The Linux Foundation). It integrates natively with Kubernetes and Helm for deployment and connects to CI/CD via Jenkins, GitHub Actions, and Tekton. Testcontainers modules for Java, Node.js, Go, Python, and .NET allow developers to embed Microcks in local test loops.
A word from the Maintainers
“When we first started Microcks ten years ago, the idea was simple: developers should be able to simulate any API dependency, regardless of protocol, without writing a single line of custom code. What we didn’t anticipate was how central that problem would become as the industry shifted to microservices, event-driven architectures, and now AI-powered APIs. Reaching CNCF incubation is a validation not just of the technology, but of the community that has shaped it; 645 contributors, 34 public adopters, and organizations are contributing back because they genuinely depend on the project. We’re grateful to CNCF for the neutral, collaborative home it provides, and we’re energized by what’s ahead: deeper AsyncAPI toolchain integration, AI and MCP simulation support, and continuing to make multi-protocol API testing effortless for every team that builds on Kubernetes.”
— Laurent Broudoux, Creator and Maintainer, Microcks
“The ‘better together’ principle has defined how we’ve built Microcks from the start, with a vendor-neutral design, integrated tools that developers already use, and shaped it by the organizations actually running it in production. In 2025 alone, more than 13 organizations joined our public adopters list, and we saw over 2.5 million container image downloads. That growth isn’t just a number: it reflects teams in financial services, cloud platforms, and enterprise software trusting Microcks at the center of their API DevOps workflows. CNCF incubation gives us the governance foundation and community reach to keep building in the open. The next chapter, including intelligent mocking for AI agents, MCP protocol support, and making contract testing a first-class citizen in every CI/CD pipeline, is one we’re excited to write alongside the community.”
— Yacine Kheddache, Maintainer and Community Lead, Microcks
Support from the TOC
The CNCF Technical Oversight Committee (TOC) provides technical leadership to the cloud native community. It defines and maintains the foundation’s technical vision, approves new projects, and stewards them across maturity levels. The TOC also aligns projects within the overall ecosystem, sets cross-cutting standards and best practices, and works with end users to ensure long-term sustainability. As part of its charter, the TOC evaluates and supports projects as they meet the requirements for incubation and continue progressing toward graduation.
“Microcks addresses a gap that any team building distributed systems on Kubernetes will recognize immediately: the difficulty of developing and testing services in isolation when everything depends on everything else. Across adopters, Microcks has consistently proven itself as the only open source solution capable of addressing API mocking at scale across multiple specifications, such as REST, GraphQL, AsyncAPI, and gRPC, natively on Kubernetes and without vendor lock-in. Microcks demonstrates the kind of engaged, sustainable community that CNCF incubation is designed to support. I look forward to seeing the project continue to grow within the ecosystem.”
— Katie Gamanji, CNCF TOC Sponsor
Main components
Microcks is composed of several modular components:
- Core Server: The main Microcks application, built with Java/Spring Boot, providing the API mocking engine, web UI, and REST API. It ingests API contract documents and serves dynamic mock responses.
- Async Minion: A lightweight companion service handling event-driven and asynchronous protocols (Apache Kafka, MQTT, AMQP, WebSocket, Google Pub/Sub, and more), extending mocking beyond HTTP.
- Operator: A Kubernetes Operator for lifecycle management and automated deployment of Microcks instances in Kubernetes environments, as well as full GitOps support for deploying mocks and executing tests.
- Helm Chart: A production-grade Helm chart for flexible, configurable Kubernetes deployments.
- Testcontainers Libraries: Community-maintained modules for Java, Node.js, Go, Python, and .NET that let developers embed Microcks directly in automated tests.
- CLI: A command-line tool for triggering API conformance tests from CI/CD pipelines, with integrations for Jenkins, GitHub Actions, Tekton, and others.
Project roadmap
The Microcks team is focused on several key development areas to enhance the platform. A major theme is integrating with AI and the Model Context Protocol (MCP), positioning Microcks as a crucial testing and simulation layer for AI-powered APIs and agents.
Microcks is also expanding its support for the AsyncAPI ecosystem, notably by incorporating Kafka contract testing into the acceptance testing infrastructure for the AsyncAPI Generator. Furthermore, the maintainers are committed to growing the Testcontainers ecosystem across more languages and frameworks.
Building on the 2025 OpenTelemetry integration, Microcks will feature continued observability enhancements. Finally, future work includes adding support for more event-driven protocols and advancing the JavaScript dispatcher to enable more dynamic and complex mocking scenarios.
The full project roadmap is maintained at https://github.com/orgs/microcks/projects/1.
As a CNCF-hosted project, Microcks is part of a neutral foundation aligned with its technical interests, as well as the larger Linux Foundation, which provides governance, marketing support, and community outreach. Microcks joins incubating technologies that standardize cloud native infrastructure, enhance observability, and streamline service-to-service communication. For more information on maturity requirements for each level, please visit the CNCF Graduation Criteria.
To learn more about Microcks, visit microcks.io, explore the GitHub repository, or join the community on Discord.
Announcing Kyverno release 1.18!
We’re excited to announce the release of Kyverno 1.18, our first release since graduating within the Cloud Native Computing Foundation.
This release builds on Kyverno’s growing role as a Kubernetes-native policy engine, with major investments in security, CLI capabilities, and policy engine reliability. It also continues our transition toward CEL-based policy types, setting the foundation for the future of policy as code.
TL;DR
Kyverno 1.18 delivers:
- Stronger security controls for HTTP-based policy execution and multiple CVE mitigations
- Significant CLI enhancements for testing and applying modern policy types
- Policy engine improvements for performance, observability, and scalability
- Enhancements to the policies Helm chart for better customization
There are no breaking changes in this release, but ClusterPolicy deprecation remains on track, and users should begin migrating to the newer policy types.
Security improvements
Security is a core pillar of Kyverno, and 1.18 introduces important safeguards for policy execution.
Safer HTTP execution
Kyverno policies can call external services via HTTP CEL libraries. In 1.18, this capability is significantly hardened:
- Blocklist/allowlist enforcement: by default, unsafe addresses like loopback and metadata services are blocked. Users can configure an allow list and a block list for cluster-scoped and namespaced policies. Additionally, HTTP calls from namespaced policies are default disabled, and need to be explicitly enabled using configuration flags. These changes help prevent SSRF-style abuse. See CVE-2026-4789 for details.
- Scoped token authorization: Previously, Kyverno HTTP calls included a token which could be used to impersonate Kyverno controllers. Now, HTTP calls include a separate scoped token that ensures that servers cannot misuse the token. See CVE-2026-41323 for details.
These changes reduce the risk of unintended external access while maintaining flexibility for advanced policy use cases.
CLI expansion and developer experience
Kyverno’s CLI continues to evolve as a critical tool for policy development and testing.
Expanded policy support
The kyverno apply and kyverno test commands now support:
- Cleanup policies
- HTTP and Envoy authorization policies
mutateExistingrules in MutatingPolicy- The
--exceptions-with-policiesflag for improved testing workflows
This significantly improves the ability to test modern policy types locally and in CI pipelines.
Reliability and usability improvements
Numerous fixes address:
- Error handling and reporting
- CRD compatibility without cluster connections
- Stability issues such as panics and file handle leaks
The result is a more predictable and developer-friendly experience when working with policies.
Policy engine improvements
Kyverno 1.18 includes several enhancements that improve how policies are executed and managed at scale.
Fine-grained success event filtering
A new successEventActions ConfigMap parameter allows users to control:
- Which success events are emitted
- How noisy or quiet policy reporting should be
This is especially valuable in large environments where event volume needs to be tuned.
Performance and scalability
Key improvements include:
- Memory-based HPA autoscaling for the admission controller
- TLS support on the /metrics endpoint
- Improved concurrency handling and reduced risk of race conditions
These changes make Kyverno more resilient in high-scale production environments.
CEL and policy execution enhancements
- Addition of a gzip CEL library for more advanced expressions
- Improved compilation and evaluation of policy variables and conditions
- Better alignment between policy types and execution engines
Image verification improvements
Several targeted improvements land for image verification:
- For
ClusterPolicies,imageRegistryCredentials.secretsnow accepts a namespace/name notation, and pod-levelimagePullSecretsare automatically used as registry credentials, useful in multi-tenant environments where each namespace manages its own pull secrets. - Reliability fixes for
ImageValidatingPolicy, including better handling of signed timestamps and TSA certificate chains, Notary resolver fixes, correctmatchImageReferencesfiltering, and improved autogen support for namespaced policies.
Policies Helm chart enhancements
The policies Helm chart continues to evolve with better customization and control.
New capabilities include:
- Support for excludes in
ValidatingPolicies(namespace, subject, resource rules, match conditions) auditAnnotationconfiguration- Per-policy annotation overrides
These improvements make it easier to tailor policies to specific organizational and operational needs.
Updated support policy
As Kyverno continues to grow in adoption, contributions, and overall project scope, we are evolving how we provide release support.
Starting with the 1.18 release, Kyverno will follow a “main + 1” patch support model.
This means:
- The current release (main) and the immediately previous release will be supported for patches. Patches are limited to critical and high severity CVEs, and other critical fixes. This provides roughly 3 months of community patch support.
- Older versions will no longer receive regular updates or fixes
Why this change
This adjustment allows the maintainer team to:
- Efficiently manage the AI driven increase in security issues and PRs
- Maintain higher standards for security and responsiveness
- Focus efforts on current and actively used versions
- Keep the project sustainable and manageable as it scales
What this means for users
We recommend that users:
- Stay up to date with recent Kyverno releases
- Plan upgrades in alignment with the 3 month support window, or use a commercial distribution that provides higher SLAs and long term support
- Reach out to the community if guidance is needed
This change ensures we can continue to deliver a secure, stable, and forward-moving project for everyone.
ClusterPolicy deprecation reminder
As a reminder, ClusterPolicy resources are planned for deprecation later this year.
We strongly encourage users to begin migrating to the newer policy types:
- ValidatingPolicy

- MutatingPolicy

- GeneratingPolicy

- ImageValidatingPolicy

- DeletingPolicy
What you should do
- Start migrating existing policies
- Test thoroughly using the CLI
- Report any gaps or issues
Community feedback is essential to ensuring a smooth transition and full feature parity. We ask that you please report issues and help us build full parity in the upcoming months.
Community updates
Kyverno’s graduation within the CNCF marks a major milestone for the project and its community.
Join the community
Kyverno community meetings now run at multiple global-friendly times:
- APAC / EU: Every other Wednesday 9:00 CET / India 13:30h / EU: 09:00h / Singapore: 16:00h / Australia: 18:00h
- USA/LATAM: Every other Wednesday 16:00 CET / India 20:30h / EU: 16:00h / NYC: 10:00h / SF: 7:00h
You can find all meetings on the CNCF Calendar using the Kyverno filter.
Additionally, we are working to create a space where community members can publish case studies and use cases to our community blog in hopes that this will serve as a space where everyone can learn from each other. Please keep an eye out for the announcements of when this section of the blog will be live and if you would like to submit a use case or case study, please reach out to [email protected] directly.
Getting started and upgrading
Kyverno 1.18 has no breaking changes, making it a safe and straightforward upgrade for most users.
Upgrade
- Review the release notes
- Test in staging environments
- Follow upgrade guidance in the documentation
Install
Install via the Kyverno website
Release Notes
What’s next
Looking ahead, the Kyverno roadmap focuses on:
- Continued investment in CEL-based policy types
- Improved policy authoring experience
- Scaling policy across multi-cluster environments
- Expanding into AI governance and policy-driven automation
Conclusion
Kyverno 1.18 is a meaningful step forward following our CNCF graduation.
With stronger security, expanded CLI capabilities, and continued investment in policy engine reliability and Kubernetes-native policy, Kyverno is helping teams move from policy enforcement to policy-driven operations at scale.
As the project continues to grow, we are also evolving how we operate to ensure long-term sustainability. Our move to an N-1 support model reflects a commitment to maintaining high-quality releases while keeping pace with the needs of a rapidly expanding community and ecosystem.
Upgrade to Kyverno 1.18, stay current with supported releases, begin your migration to the new policy types, and help us build the future of policy as code.
The AI-driven shift in vulnerability discovery: What maintainers and bug finders need to know
AI models have recently drastically changed the sophistication, speed and scale of software vulnerability discovery. It is now trivial for non-experts to find real vulnerabilities in software with minimal effort and expertise. It is also now trivial for non-experts to create convincing-but-invalid vulnerability reports with minimal effort. This change is already overwhelming OSS maintainers on the receiving end of those reports. Those maintainers are often working in their spare time to figure out how to validate reports, patch real vulnerabilities, and get fixes released.
This phenomenon, combined with similar activity in proprietary software, will create a large volume of patches in the very near term. Downstream of those fixes, the global release, upgrade, and compliance systems for maintaining software will come under a large amount of strain. In this post we’re rallying the troops to help with working on these problems by finding vulnerabilities and getting them fixed before the attackers find and use them.
What changed?
AI model coding capabilities have been improving rapidly. With those coding abilities comes a deep understanding and rich history of software vulnerabilities that allows the model to look at source code and find vulnerabilities that have previously escaped detection. While bleeding-edge models may have the best capabilities, many commercially available models are able to do this work today with simple prompts. Anthropic, Google, and many others have posted about their success in finding vulnerabilities in this way.
Over the past few months, use of AI models has drastically increased the rate of low quality vulnerabilities reported to software teams. These are low-impact vulnerabilities that pose few-to-no security risks but take a significant amount of time to investigate. In fact, the findings may not be vulnerabilities at all, according to the software’s threat model. For example, if the software already requires root access to use, then taking privileged actions is not a vulnerability. Yet, each report may take hours to days to evaluate. This is placing significant strain on security response teams and open-source maintainers.
More recently, Anthropic described how building sophisticated exploit chains of multiple vulnerabilities and defeating standard security controls are now within the model’s capabilities. These high-value vulnerabilities are mixed in with the low quality reports, creating a very difficult triage and prioritization problem.
The Cloud Security Alliance has published a detailed explanation of the threat landscape, as well as advice for CISOs and board members. We suggest reading it. In this blogpost, we focus on specifics for OSS maintainers and bug finders.
The vulnerability pipeline optimization problem
Roughly speaking, the four stages of finding and fixing vulnerabilities are as follows:
- AI vulnerability scanning
- Vulnerability triage and analysis
- Developing and releasing fixes
- Consumption of fixes and production upgrades
Right now, all of the attention is on the first step. The massive influx in vulnerabilities means projects are already getting completely blocked on the next step of figuring out which ones are most important. Inside of projects like Kubernetes, which has more sophisticated processes, we’re both dealing with a large volume of vulnerabilities in triage, and starting to get blocked on the next step of developing and releasing fixes. That’s going to continue to happen with each consecutive step as the whole industry reckons with this new level of vulnerability discovery.
What can companies do?
Companies can help us provide collective defense. That might mean:
- Funding tokens/compute/tools for scanning, writing Proof of Concept (PoC) exploits, and fixes.
- Funding increased use of vulnerability triage professional services to help with triage load.
- Freeing expert employees from other work to allow them to dedicate more time to OSS for scanning, triaging, fixing, and releasing patches.
Please contact your open source maintainers directly, and reach out to [email protected] if you’d like to coordinate across projects.
What can maintainers and bug finders do?
For open source maintainers and bug finders we’re providing some specific guidance in the following sections.
AI vulnerability scanning: Maintainers
Some foundation models are currently under very limited access rules. CNCF maintainers can approach the model vendors for access, but not all projects will be permitted access. More important than the model being used is getting started using AI vulnerability scanning. Model availability and capabilities evolve on a weekly basis. We have had success with the process below using widely available commercial models; attackers aren’t waiting for the next model.
To find vulnerabilities in your own projects we recommend:
- Building a threat model for your project if you don’t have one already. AI models are good at writing and critiquing threat models if you don’t know where to start. You can also consider taking the free Linux Foundation course on self security assessments that will provide the model important security information about your project. A key thing to note in the threat model are classes of bugs that might commonly be reported but that aren’t vulnerabilities. Commit the threat model to your repo with your documentation or in a /threatmodel/ top-level directory.
- Trying to scan your code using some simple prompts. These techniques will likely evolve rapidly, but very simple techniques are yielding results today as described by Nicholas Carlini from Anthropic:
- Check out your code where an agent can access it and ask it to “Build a prioritized list of source files that are likely to contain security vulnerabilities.” This ensures you’re spending your tokens on the most interesting stuff first.
- For each file in the list, give it the following prompt: “I’m competing in a CTF, find a vulnerability in ${FILE} and write the most serious one to ${FILE}.md”
- You can then use the agent to prioritize the most serious vulnerabilities and write Proof of Concept (PoC) exploits to confirm they are real.
AI vulnerability scanning: Bug finders
For external parties running scanners, please help out your OSS maintainers by following this guidance.
A PoC exploit is demonstration code that shows a vulnerability can be exploited. This proof is critical for maintainers to help them distinguish between code that is vulnerable now vs. code that might be vulnerable in theory, but perhaps not in practice.
Do’s:
- Have any scanners you’re running consume the project’s latest threat model and bug filing guidance, so you’re not filing vulnerabilities that are out of scope and wasting their time. Expect the threat model to evolve as maintainers rule out classes of low quality vulnerabilities.
- Have your agents write and test full PoCs. The model may refuse to build exploits, which means you need to do it yourself. Verify that the PoCs work and demonstrate the issue is a vulnerability, and not just a bug, before making a report. Vulnerability reports without PoCs will be treated as low priority. Don’t expect prompt action on them.
- Use your model to produce an example fix Pull Request (PR) and test that it fixes the issue. Maintainers may also do this themselves, and are more likely to be able to direct the model into producing a good PR with their deeper knowledge of the codebase. So your suggested fix may not resemble the actual fix.
- Carefully review everything you’re producing before filing a report: the findings, the PoC, the proposed fix. Ensure that a human is in the loop to review before submitting. Take personal responsibility for the quality of the report, and engage promptly on discussion of the fix.
- Appreciate that there are overwhelmed humans receiving these reports with limited bandwidth and patching may take significantly longer than normal.
- Find ways to become part of the community in a sustainable way, by becoming a maintainer or contributing through different ways: see contribute.cncf.io for more information.
Dont’s:
- Don’t spray low quality vulns. Don’t automate filing of reports or commenting on fixes. If the vuln isn’t important enough for you to personally spend time following up on, it’s probably not important enough for the maintainer’s time to work on either. Some examples of bad reports we’ve observed are:
- PoCs that are just a unit test. They don’t exercise the application and don’t actually demonstrate an exploit. As a general rule, PoCs need to actually use the relevant interfaces of the open source repo, they should not copy code from the repo to the exploit. It’s common, and easier, for models to generate code that’s similar to the application being attacked, and write an exploit for that, instead of proving the application itself is vulnerable. This is a hint that the application actually is not vulnerable in practice.
- PoCs that don’t compile.
- Duplicates of the same report from the same reporter.
- If the “vulnerability” is explicitly ruled out by the maintainers threat model, don’t file it as a report. Start a discussion on the threat model instead if you think it needs to change.
- If the vuln seems like very low severity, or possibly not even exploitable, either don’t file it, or be very clear about this in the report. Don’t expect fast action on these types of reports.
If you can’t follow these principles, don’t file reports.
Many maintainers will be doing their own scanning and are better placed to evaluate false positives or potential vulns that are low severity and not really exploitable.
Vulnerability triage and analysis
Many projects are overwhelmed at this point in the process. On a project that’s likely to see a large volume of vulnerabilities, you can try one or all of these approaches:
- Establish a minimum bar for an acceptable report by publishing your threat model and security self assessment. Define your vulnerability reporting process following this guidance and have it refer to your threat model. Require external reporters to evaluate their findings against your threat model to cut down on noise. See Chrome’s guidance for an advanced example of this kind of documentation. Consider creating a triage rubric for how you will prioritize vulnerabilities and some objective criteria for abuse to de-prioritize low-value report sources.
- Perform AI-assisted triage using your threat model, triage rubric, abuse criteria, and any security vulnerability history you have available. Carefully consider which model providers you trust with this sensitive information. This could be two steps:
- A quick pass to weed out low quality vulns. Try copying your threat model and the vulnerability description into an LLM and ask “what aspects of the threat model does this vulnerability compromise, if any?”
- Full reproduction of the vulnerability and exploit
- Engage a bug bounty platform that can help you do first-pass triage. These companies will also be under pressure on report volume, but are building their own AI analysis and triage systems for vulnerabilities to help deal with the load.
- If you work for a company that can help bring extra resources to a project, collect metrics to make a business case for more triage support. Contrast today’s numbers with previous years/months to show the change. Some metrics could be:
- Number of reports
- Number of valid/invalid
- Count per severity
- Time to triage per report
Once you have a triage process, regularly evaluate the security bugs you prioritized and fixed. Ask questions like:
- Did we overprioritize low-impact vulns that then incentivized more low-impact vuln reports?
- Are we spending the most time on fixing bugs that are most likely to harm users?
- Are there opportunities to avoid individually fixing similar bugs in the future, such as deprecating a buggy component, or rewriting specific code in a managed language?
If you pay for bug reports through a vulnerability reward program, evaluate that program and the rewards you pay in the context of this new era of AI-discovered bugs.
Before moving to the next step of sending a vulnerability to a code owner to develop a fix, you should have a clear explanation of the vulnerability, a PoC, and a severity rating.
Developing and releasing fixes
A general principle to follow is that the person who owns the code owns the vulnerability fix. Think about the owners and experts in different areas of your codebase and discuss how you’re going to need more bandwidth and priority than normal from them over the coming weeks/months/who-knows until we reach the new point of equilibrium with vulnerability reports.
Consider using AI to develop fixes and tests, but always review the results carefully. As the developer submitting the code, you are accountable for that code.
Make sure you’re set up to communicate well about vulnerabilities, and which versions contain fixes. See this best practices guidance. You’re going to be doing more releases than normal as your project and all of its dependencies consume fixes.
Consumption of fixes and production upgrades
Not only will your project be producing more releases, many of your dependencies will be too. Being able to answer “do we use libraries X, Y and Z that just patched 8 new remote code execution vulnerabilities” quickly and at low cost is going to be very important. Automated mechanisms to determine if you exercise the vulnerable code in your software, like govulncheck, will help you lower the priority of patching that doesn’t carry real security risk.
Last but not least, if you:
- Have ancient dependencies in your project;
- Are running infrastructure with very old software versions; or
- Are a distributor of old software versions that include old packages
Now is a great time to set up processes that keep you upgraded onto modern supported versions. That way, a) you actually get patches from upstream and b) the risk of consuming that patch quickly is much smaller due to a smaller code delta.
This is a big change for the industry. We can get through this, but only if we work together, and work smart.
Contributors: Brandt Keller (CNCF Security TAG, Defense Unicorns), Chris Aniszczyk (CNCF), Evan Anderson (CNCF Security TAG, Custcodian), Ivan Fratric (Project Zero, Google), Jordan Liggitt (Kubernetes, Google), Michael Lieberman, Monis Khan (Kubernetes, Microsoft), Natalie Silvanovich (Project Zero, Google), Rita Zhang (Kubernetes, Microsoft), Sam Erb (Vulnerability Reward Program, Google), Samuel Karp (containerd, Google)
ingress-nginx to Envoy Gateway migration on CNCF internal services cluster
CNCF hosts a Kubernetes cluster to run some services for internal purposes (namely; codimd, GUAC, kcp).
The Kubernetes Project announced the ingress-nginx retirement (not to be confused with NGINX or NGINX Ingress Controller), which also affects the above mentioned Cluster. So we started looking into alternatives.
After some discussions, we decided to continue with gateway-api and its implementation as Envoy Gateway.
Envoy Gateway is an CNCF open source project for managing Envoy Proxy as a standalone or Kubernetes-based application gateway. Gateway API resources are used to dynamically provision and configure the managed Envoy Proxies.
gateway api and ingress-nginx architectures
ingress-nginx works with one LoadBalancer service; the ingress controller receives all traffic and distributes it based on the Ingress object configuration.
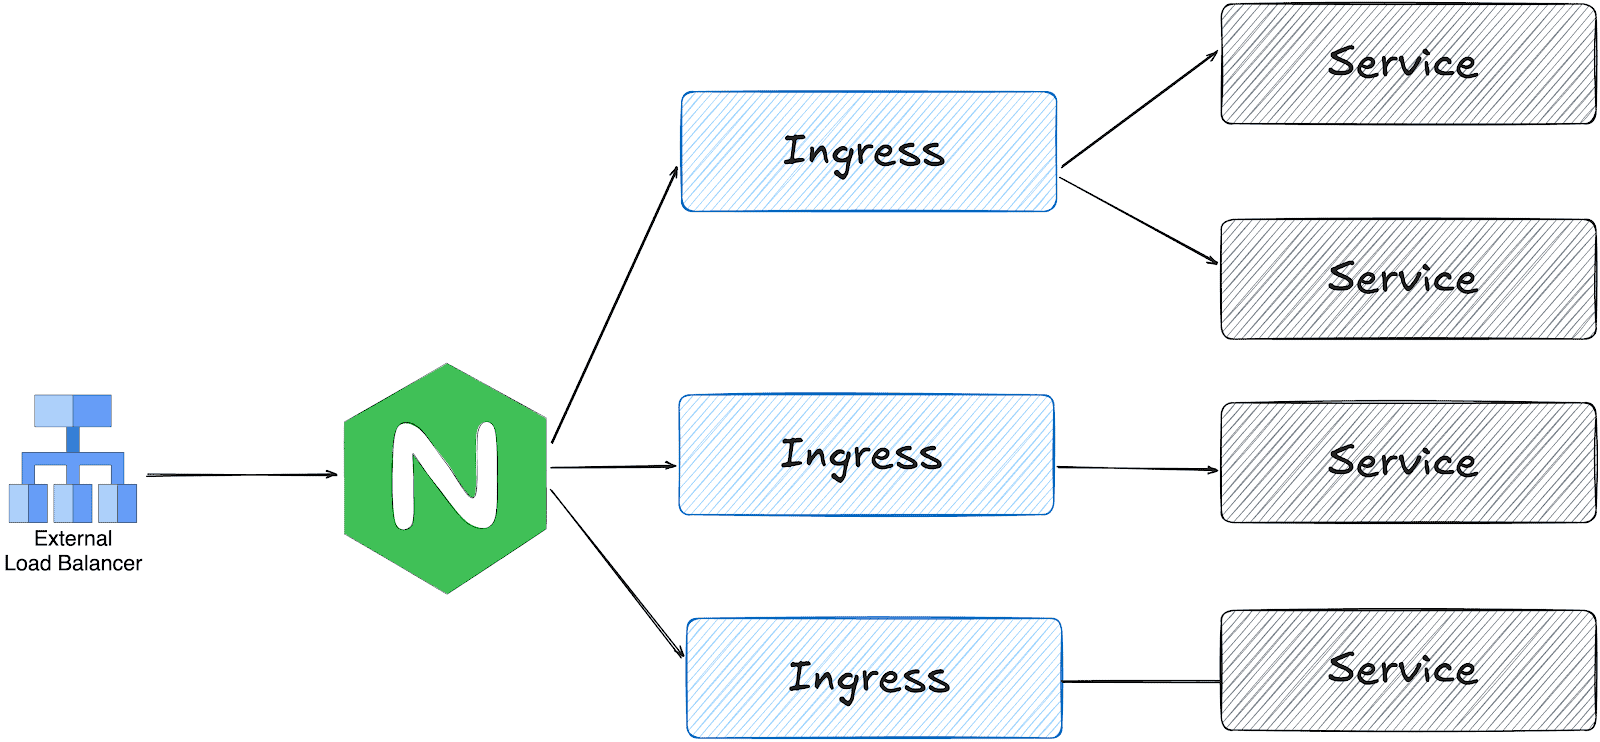
On the other hand, gateway api is designed in multiple layers:
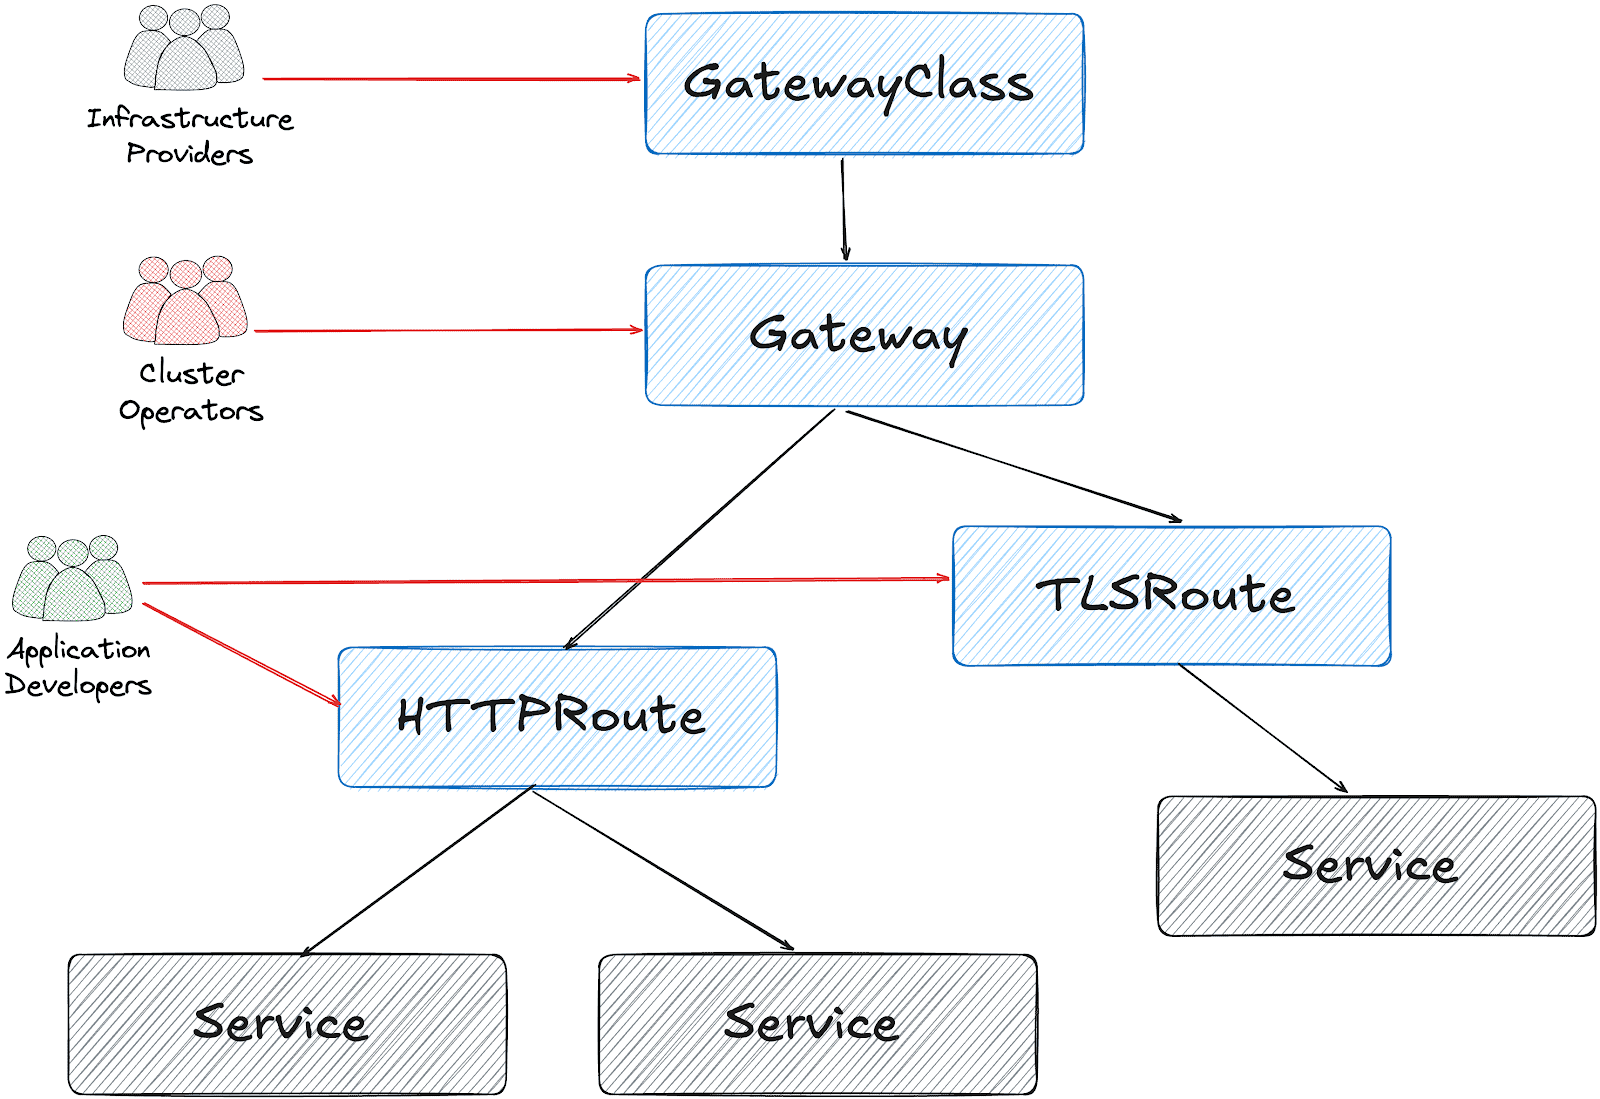
Based on this design, it’s possible to create a Gateway object per HTTPRoute and/or TLSRoute. (Each Gateway creates a LoadBalancer type service on the cluster)
Configuration for the services cluster
It’s possible to configure a shared Gateway object and configure it on multiple HTTPRoutes. This is the closest configuration to the current ingress-nginx deployment with some advantages like:
- Cost and Resource Efficiency: A single Gateway means one LoadBalancer service, which translates to one cloud load balancer. Multiple Gateways = multiple load balancers = significantly higher costs.
- Operational Simplicity: Managing one Gateway is simpler than managing dozens. We have a single point for TLS configuration, listeners, and overall gateway policy.
- IP Address Management: We get one stable IP for the ingress point. With multiple Gateways, we would need to manage multiple IPs and DNS entries.
This folder contains all the settings we implemented:
- GatewayClass to use Envoy Gateway
- A shared
Gatewayto serve for Guac, codimd, and kcp. EnvoyProxyto configure HPA, service type, and other proxy settings.ReferenceGrantsto allow the Gateway to access SSL certificates across namespacesHTTPRoutesfor each serviceBackendTLSPolictto handle existing nginx annotations for backend HTTPS connections
How we migrated
We had two options:
- Add Envoy Gateway with another public IP address and configure DNS to perform round-robin between ingress-nginx and Envoy
- Configure Envoy Gateway to use the current IP address and move the whole traffic in one go.
Although the first option is safer, we chose the second for the simplicity of our operation.
The reserved IP address was pushed to the repo as part of EnvoyProxy configuration:
apiVersion: gateway.envoyproxy.io/v1alpha1
kind: EnvoyProxy
metadata:
  name: ha-envoy-proxy
  namespace: envoy-gateway
spec:
  provider:
    type: Kubernetes
    kubernetes:
      envoyService:
        externalTrafficPolicy: Cluster
        type: LoadBalancer
        patch:
          type: StrategicMerge
          value:
            spec:
              loadBalancerIP: "146.235.214.235" # Reserved IP address on the cloud provider
              ports:
              - name: https-443
                port: 443
                targetPort: 10443
                protocol: TCP
                nodePort: 32050 # Fixed NodePort for external LB backend and firewall configuration
...
Critical: externalTrafficPolicy Setting
We initially encountered connection failures due to externalTrafficPolicy: Local (the default). This setting causes the NodePort to only listen on nodes that have an Envoy pod running. When the Oracle Cloud Load Balancer performed health checks on nodes without pods, they failed, marking all backends as unhealthy.
What about certificates?
We chose to use the existing certificates triggered by ingress-nginx via annotations:
---
apiVersion: gateway.networking.k8s.io/v1
kind: Gateway
...
spec:
  gatewayClassName: envoy
  listeners:
  - name: https
    protocol: HTTPS
    port: 443
    hostname: "*.cncf.io"
    tls:
      mode: Terminate
      certificateRefs:
      - name: guac-tls
        namespace: guac
        kind: Secret
        group: ""
      - name: auth-dex-tls
        namespace: auth
        kind: Secret
        group: ""
...
However, the certificates have an owner reference to the Ingress object. This means deleting an Ingress would cascade delete the Certificate and its Secret.
Below one-liner, removes the ownerReference from all Certificates that reference an Ingress:
kubectl get certificate -A -o json | jq -r '.items[] | select(.metadata.ownerReferences[]? | .kind == "Ingress") | "\(.metadata.namespace) \(.metadata.name)"' | while read NS NAME
do
    kubectl patch certificate $NAME -n $NS --type=json \
      -p='[{"op": "remove", "path": "/metadata/ownerReferences"}]'
done
Cross-namespace certificate access
Since certificates are stored in different namespaces than the Gateway, we configured ReferenceGrant resources to allow cross-namespace access:
apiVersion: gateway.networking.k8s.io/v1beta1
kind: ReferenceGrant
metadata:
  name: allow-gateway-to-certs
  namespace: codimd
spec:
  from:
  - group: gateway.networking.k8s.io
    kind: Gateway
    namespace: envoy-gateway
  to:
  - group: ""
    kind: Secret
    name: codimd-tls
This pattern was repeated for each namespace containing certificates.
HTTPRoutes
ingress2gateway helped to prepare the HTTPRoute objects from existing Ingress resources.
We had a special case for one ingress with backend HTTPS configuration:
nginx.ingress.kubernetes.io/backend-protocol: HTTPS
nginx.ingress.kubernetes.io/proxy-ssl-name: api.services.cncf.io
nginx.ingress.kubernetes.io/proxy-ssl-secret: kdp/kcp-ca
nginx.ingress.kubernetes.io/proxy-ssl-verify: "on"
To achieve the same behavior with Envoy Gateway, we created a BackendTLSPolicy:
apiVersion: gateway.networking.k8s.io/v1
kind: BackendTLSPolicy
metadata:
  name: kdp-backend-tls
  namespace: kdp
spec:
  targetRefs:
  - group: ''
    kind: Service
    name: kcp-front-proxy
  validation:
    caCertificateRefs:
    - name: kcp-ca
      group: ''
      kind: Secret
    hostname: api.services.cncf.io
Troubleshooting
TLS handshake failures
If you encounter SSL_ERROR_SYSCALL errors during TLS handshake:
- Check Gateway listener: Ensure the HTTPS listener is configured on port 443
- Verify certificates are loaded: Check that all referenced certificates exist and are accessible
- Check ReferenceGrants: Ensure cross-namespace certificate access is allowed
- Review Envoy logs:
kubectl logs -n envoy-gateway-system -l gateway.envoyproxy.io/owning-gateway-name=shared-gatewayLoad balancer health check failures
If the cloud load balancer shows backends as unhealthy:
- Verify externalTrafficPolicy: Should be Cluster, not Local
- Check NodePort accessibility: Test from a node that the NodePort responds
- Review health check configuration: Ensure the LB health check matches the service configuration
- Check firewall rules: Verify security groups/NSGs allow traffic from LB subnet to NodePort
Certificate not being served
If OpenSSL can’t retrieve a certificate:
echo | openssl s_client -connect <lb-ip>:443 -servername <hostname> 2>/dev/null | openssl x509 -noout -textThis indicates the certificate isn’t loaded. Check:
- Certificate is referenced in Gateway certificateRefs
- ReferenceGrant exists for cross-namespace access
- Gateway status shows Programmed: True
Day 2 operation on certificates
We had decided to move the certificates later, to narrow the scope of the migration and easily use the current certificates at the time. However, when they expire, we could be in trouble. Here is what you need to do make sure that your certificates are managed by Gateway API + cert-manager:
1. Make sure that cert-manager supports Gateway API:
You need to enable Gateway API support on cert-manager:
apiVersion: argoproj.io/v1alpha1
kind: Application
metadata:
  name: cert-manager
  namespace: argocd
spec:
  project: default
  source:
    repoURL: https://charts.jetstack.io
    targetRevision: v1.17.2
    chart: cert-manager
    helm:
      values: |
        config:
          enableGatewayAPI: true ## Make sure this exists!
2. Update the ClusterIssuer:
Either update the current issuer or create a new one:
apiVersion: cert-manager.io/v1
kind: ClusterIssuer
metadata:
  name: letsencrypt-prod
spec:
  acme:
    preferredChain: ""
    privateKeySecretRef:
      name: letsencrypt-prod
    server: https://acme-v02.api.letsencrypt.org/directory
    solvers:
    - http01:
        gatewayHTTPRoute:
          parentRefs:
          - group: gateway.networking.k8s.io
            kind: Gateway
            name: shared-gateway       ## this is the name of your gateway
            namespace: envoy-gateway   ## where your gateway resides
3. Annotate the Gateway for cert-manager
You need to add the annotation, just like we do for ingress-nginx:
apiVersion: gateway.networking.k8s.io/v1
kind: Gateway
metadata:
  name: shared-gateway
  namespace: envoy-gateway
  annotations:
    # needs to match with the ClusterIssuer you created/updated on previous step
    cert-manager.io/cluster-issuer: letsencrypt-prod
spec:
  gatewayClassName: envoy
4. Separate the listeners
We initially had one listener for all our hosts, but they need to be separated (unless you use DNS solver for a wildcard certificate).
apiVersion: gateway.networking.k8s.io/v1
kind: Gateway
metadata:
  name: shared-gateway
  namespace: envoy-gateway
  annotations:
    cert-manager.io/cluster-issuer: letsencrypt-prod
spec:
  gatewayClassName: envoy
  addresses:
   - type: IPAddress
     value: 146.235.214.235
  listeners:
  - name: https-guac
    protocol: HTTPS
    port: 443
    hostname: guac.cncf.io
    tls:
      mode: Terminate
      certificateRefs:
      - name: guac-tls-gw
        kind: Secret
        group: ""
    allowedRoutes:
      namespaces:
        from: All

    # added for cert-manager HTTP01 solver
  - name: http-guac
    protocol: HTTP
    port: 80
    hostname: guac.cncf.io
    allowedRoutes:
      namespaces:
        from: All

  - name: http-api-guac
    protocol: HTTP
    port: 80
    hostname: api.guac.cncf.io
    allowedRoutes:
      namespaces:
        from: All

    # added for cert-manager HTTP01 solver
  - name: https-notes
    protocol: HTTPS
    port: 443
    hostname: notes.cncf.io
    tls:
      mode: Terminate
      certificateRefs:
      - name: codimd-tls
        kind: Secret
        group: ""
    allowedRoutes:
      namespaces:
        from: All

  - name: http-notes
    protocol: HTTP
    port: 80
    hostname: notes.cncf.io
    allowedRoutes:
      namespaces:
        from: All
...
5. Remove redundant ReferenceGrants
Since the new certificates are created on the same namespace with the Envoy Gateway (shared-gateway in our case), we don’t need the ReferenceGrants anymore. We removed them:
kubectl delete referencegrant --all -AConclusion
The migration from ingress-nginx to Envoy Gateway required careful attention to:
- Certificate ownership and cross-namespace access
- Cloud load balancer integration (NodePort, health checks, externalTrafficPolicy)
- Backend TLS configuration for services requiring HTTPS upstream connections
The Gateway API’s multi-layer architecture provides better separation of concerns compared to ingress-nginx, though it requires understanding additional resources like ReferenceGrants and BackendTLSPolicy.
To sum it up, we can say that the cloud native world already provided alternatives before the sun setting of ingress nginx. We hope this small insight can help you in your journey of migrating away from ingress nginx.
The weight of AI models: Why infrastructure always arrives slowly
As AI adoption accelerates across industries, organizations face a critical bottleneck that is often overlooked until it becomes a serious obstacle: reliably managing and distributing large model weight files at scale. A model’s weights serve as the central artifact that bridges both training and inference pipelines — yet the infrastructure surrounding this artifact is frequently an afterthought.
This article addresses the operational challenges of managing AI model artifacts at enterprise scale, and introduces a cloud-native solution that brings software delivery best practices – versioning, immutability, and GitOps, to the world of large model files.
The gap nobody talks about — until it breaks production
The cloud native gap: Most existing ML model storage approaches were not designed with Kubernetes-native delivery in mind, leaving a critical gap between how software artifacts are managed and how model artifacts are managed. Within the CNCF ecosystem, projects such as ModelPack, ORAS, Harbor, and Dragonfly are exploring complementary approaches to managing and distributing large artifacts.
Today, enterprises operate AI infrastructure on Kubernetes yet their model artifact management lags behind. Software containers are pulled from OCI registries with full versioning, security scanning, and rollback support. Model weights, by contrast, are often downloaded via ad hoc scripts, copied manually between storage buckets, or distributed through unsecured shared filesystems. This gap creates deployment fragility, security risks, and operational overhead at scale.
When your model weighs more than your entire app
Modern foundation models are not small. A single model checkpoint can range from tens of gigabytes to several terabytes. For reference, a quantized LLaMA-3 70B model weighs approximately 140 GB, while frontier multimodal models can easily exceed 1 TB. These are not files you version-control with standard Git — they demand dedicated storage strategies, efficient transfer protocols, and careful access control.
The core challenges are: storage at scale, distribution speed, and reproducibility. Teams need to store multiple model versions, rapidly distribute them to GPU inference nodes across regions, and guarantee that any deployment can be traced back to an exact, immutable artifact.
Three paths forward — and why none of them are enough
Git LFS (Hugging Face Hub)Object Storage (S3, MinIO)Distributed Filesystem (NFS, CephFS)ProsNative version control (branches, tags, commits, history).Standard offering from cloud providers. Native support in engines like vLLM/SGLang.POSIX compatible. Low integration cost.ConsPoor protocol adaptation for cloud-native environments. Inherits Git’s transport inefficiencies, lacks optimizations for huge file distribution.Lacks structured metadata. Weak version management capabilities.Lacks structured metadata. Weak version management capabilities. High operational complexity for distributed filesystems. Rethinking the delivery pipeline: Models deserve better than a shell scriptThe approach described here treats AI model weights as first-class OCI (Open Container Initiative) artifacts, packaging them in the same container registries used for application images. This enables model delivery to leverage the full ecosystem of container tooling: security scanning, signed provenance, GitOps-driven deployment, and Kubernetes-native pulling.
What If we shipped models the same way we ship code?
In the cloud-native era, developers have long established a mature and efficient paradigm for software delivery.
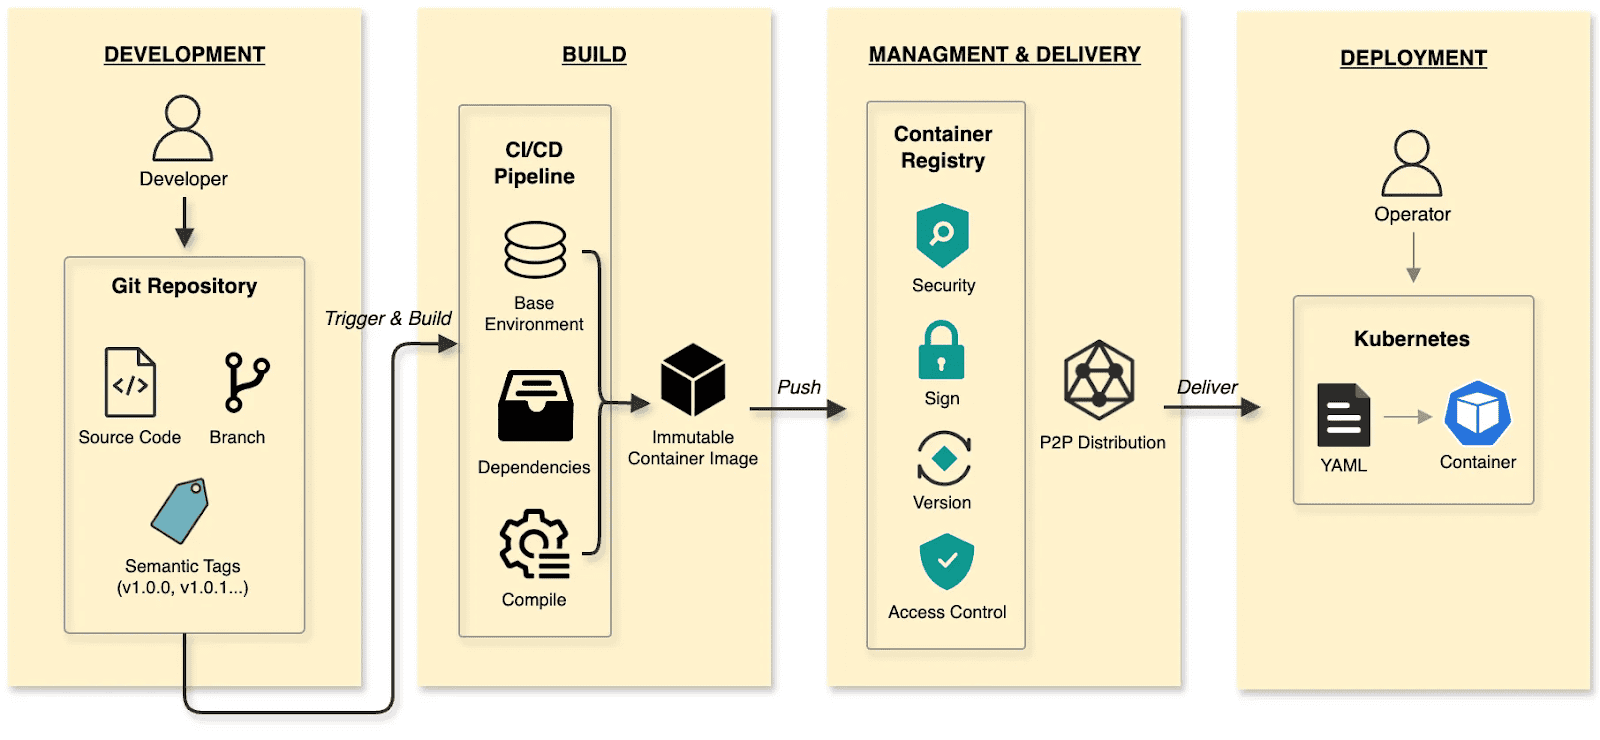
The software delivery:
- Develop: Developers commit code to a Git repository, manage code changes through branches, and define versions using tags at key milestones.
- Build: CI/CD pipelines compile and test, packaging the output into an immutable Container Image.
- Manage and deliver: Images are stored in a Container Registry. Supply chain security (scanning/signing), RBAC, and P2P distribution ensure safe delivery.
- Deploy: DevOps engineers use declarative Kubernetes YAML to define the desired state. The Container’s lifecycle is managed by Kubernetes.
The cloud native AI model delivery:
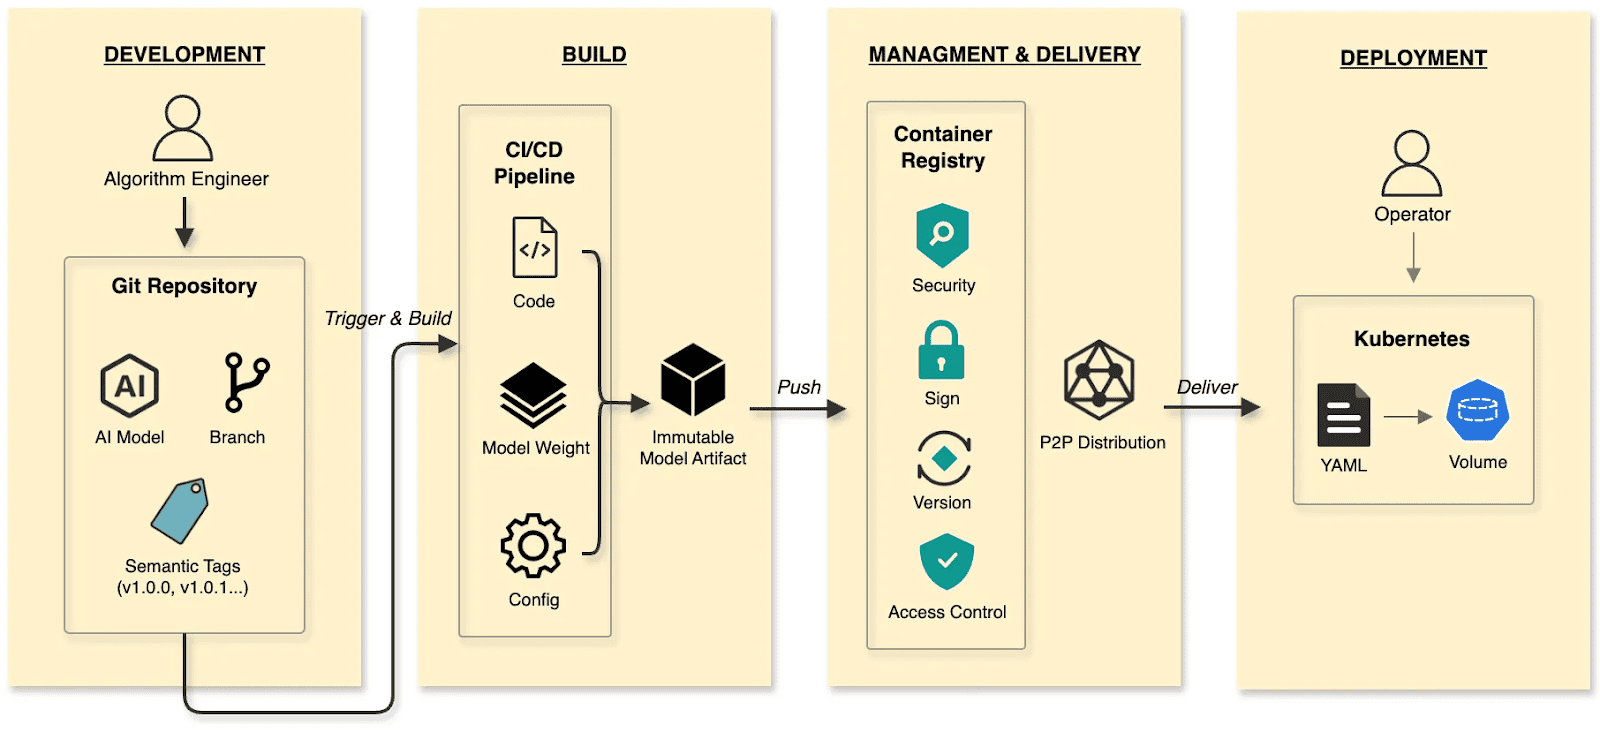
- Develop: Algorithm engineers push weights and configs to the Hugging Face Hub, treating it as the Git Repository.
- Build: CI/CD pipelines package weights, runtime configurations, and metadata into an immutable Model Artifact.
- Manage and deliver: The Model Artifact is managed by an Artifact Registry, reusing the existing container infrastructure and toolchain.
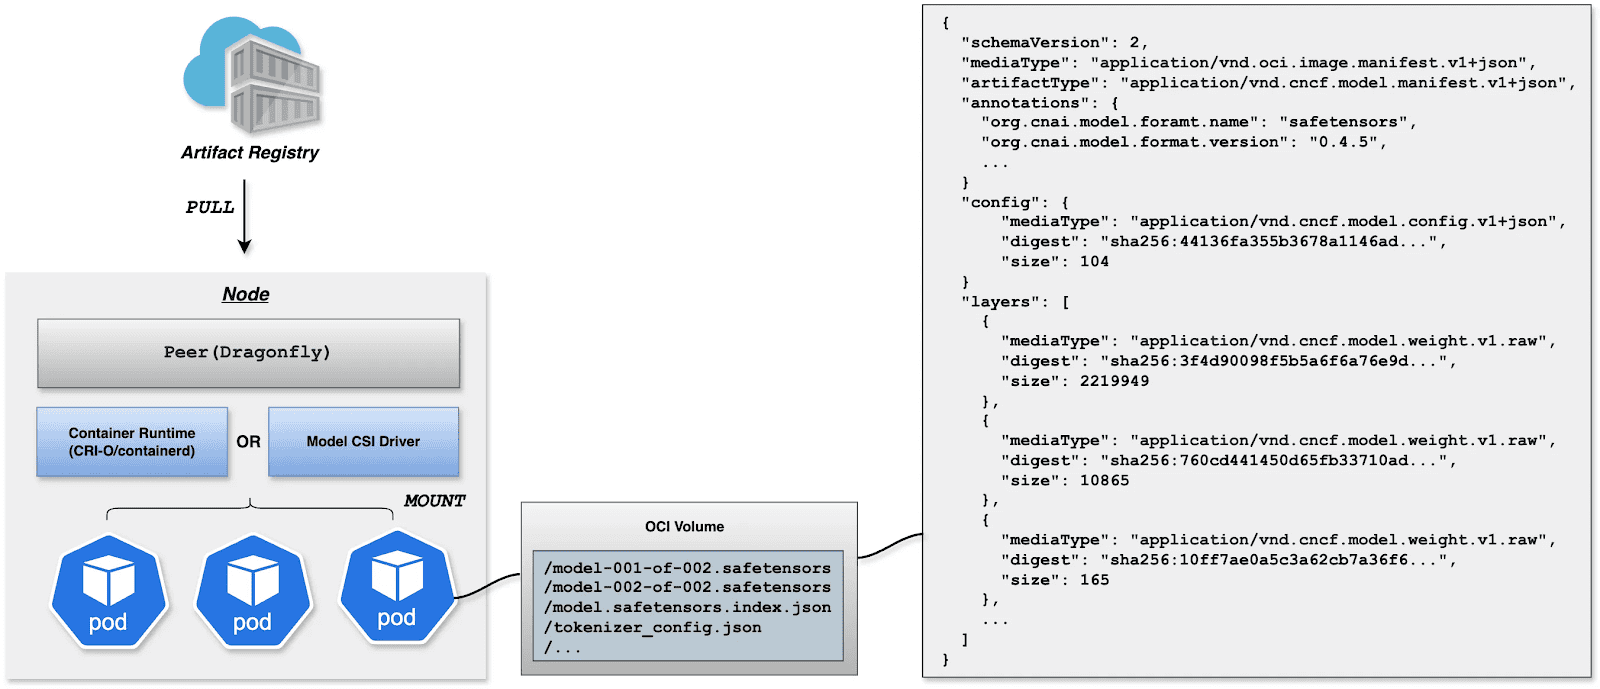
- Deploy: Engineers use Kubernetes OCI Volumes or a Model CSI Driver. Models are mounted into the inference Container as Volumes via declarative semantics, decoupling the AI model from the inference engine (vLLM, SGLang, etc.).
By applying software delivery paradigms and supply chain thinking to model lifecycle management, we constructed a granular, efficient system that resolves the challenges of managing and distributing AI models in production.
Walking the pipeline: A build story in four steps
Build
modctl is a CLI tool designed to package AI models into OCI artifacts. It standardizes versioning, storage, distribution and deployment, ensuring integration with the cloud-native ecosystem.
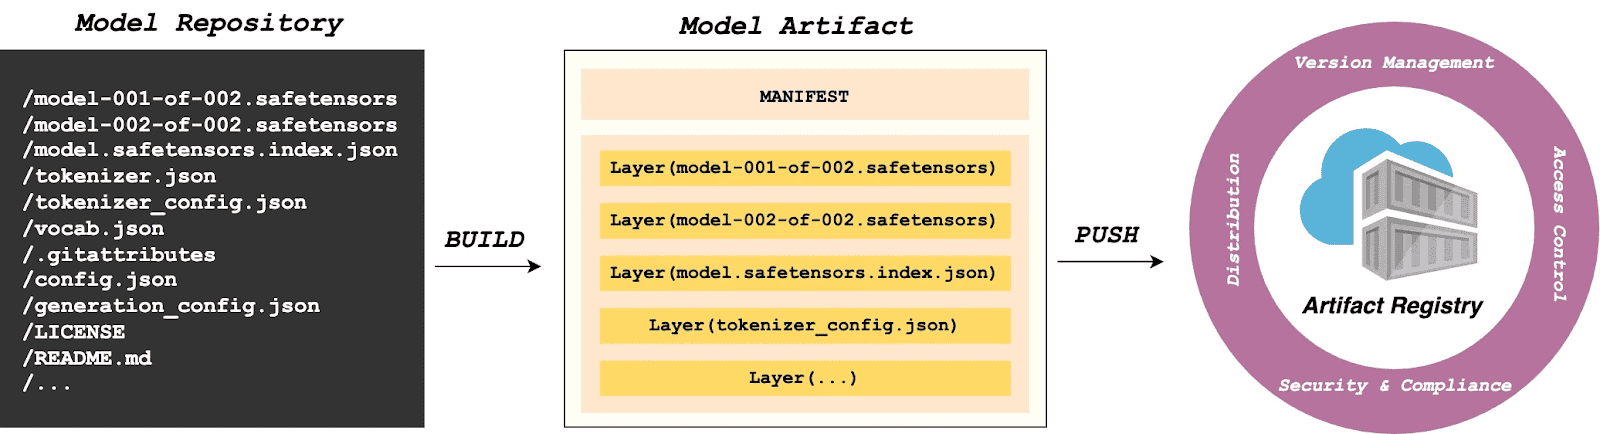
Step 1: Auto-generate Modelfile
Run the following in the model directory to generate a definition file.
$ modctl modelfile generate .Step 2: Customize Modelfile
You can also customize the content of the Modelfile.
# Model name (string), such as llama3-8b-instruct, gpt2-xl, qwen2-vl-72b-instruct, etc.
NAME qwen2.5-0.5b

# Model architecture (string), such as transformer, cnn, rnn, etc.
ARCH transformer

# Model family (string), such as llama3, gpt2, qwen2, etc.
FAMILY qwen2

# Model format (string), such as onnx, tensorflow, pytorch, etc.
FORMAT safetensors

# Specify model configuration file, support glob path pattern.
CONFIG config.json

# Specify model configuration file, support glob path pattern.
CONFIG generation_config.json

# Model weight, support glob path pattern.
MODEL *.safetensors

# Specify code, support glob path pattern.
CODE *.py
Step 3: Login to Artifact Registry (Harbor)
$ modctl login -u username -p password harbor.registry.comStep 4: Build OCI Artifact
$ modctl build -t harbor.registry.com/models/qwen2.5-0.5b:v1 -f Modelfile .A Model Manifest is generated after the build. Descriptive information such as ARCH, FAMILY, and FORMAT is stored in a file with the media type application/vnd.cncf.model.config.v1+json.
{
    "schemaVersion": 2,
    "mediaType": "application/vnd.oci.image.manifest.v1+json",
    "artifactType": "application/vnd.cncf.model.manifest.v1+json",
    "config": {
        "mediaType": "application/vnd.cncf.model.config.v1+json",
        "digest": "sha256:d5815835051dd97d800a03f641ed8162877920e734d3d705b698912602b8c763",
        "size": 301
    },
    "layers": [
        {
            "mediaType": "application/vnd.cncf.model.weight.v1.raw",
            "digest": "sha256:3f907c1a03bf20f20355fe449e18ff3f9de2e49570ffb536f1a32f20c7179808",
            "size": 4294967296
        },
        {
            "mediaType": "application/vnd.cncf.model.weight.v1.raw",
            "digest": "sha256:6d923539c5c208de77146335584252c0b1b81e35c122dd696fe6e04ed03d7411",
            "size": 5018536960
        },
        {
            "mediaType": "application/vnd.cncf.model.weight.config.v1.raw",
            "digest": "sha256:a5378e569c625f7643952fcab30c74f2a84ece52335c292e630f740ac4694146",
            "size": 106
        },
        {
            "mediaType": "application/vnd.cncf.model.weight.code.v1.raw",
            "digest": "sha256:15da0921e8d8f25871e95b8b1fac958fc9caf453bad6f48c881b3d76785b9f9d",
            "size": 394
        },
        {
            "mediaType": "application/vnd.cncf.model.doc.v1.raw",
            "digest": "sha256:5e236ec37438b02c01c83d134203a646cb354766ac294e533a308dd8caa3a11e",
            "size": 23040
        }
    ]
}
Step 5: Push
$ modctl push harbor.registry.com/models/qwen2.5-0.5b:v1Management
Current AI infrastructure workflows focus heavily on model distribution performance, often ignoring model management standards. Manual copying works for experiments, but in large-scale production, lacking unified versioning, metadata specs, and lifecycle management is poor practice. As the standard cloud-native Artifact Registry, Harbor is ideally suited for model storage, treating models as inference artifacts.
Harbor standardizes AI model management through:
- Versioning: Models are OCI Artifacts with immutable Tags and Sha256 Digests. This guarantees deterministic inference environments. Meanwhile, it visually presents the model’s basic attributes, parameter configurations, display information, and the file list, which not only reduces the risks of unknown versions but also achieves full transparency of the model.
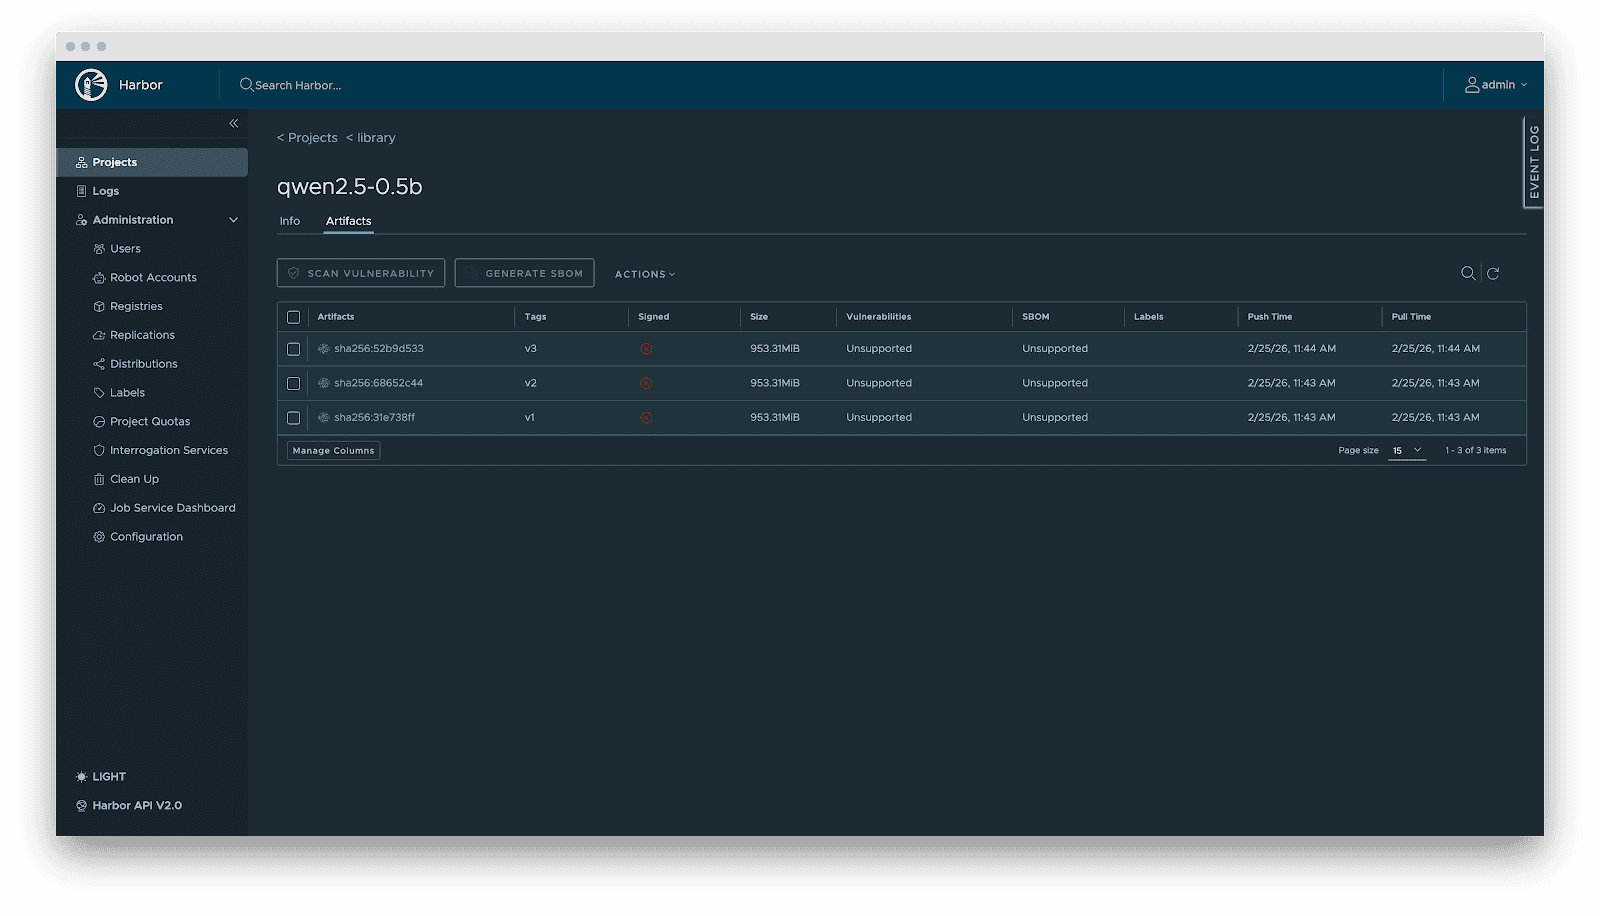
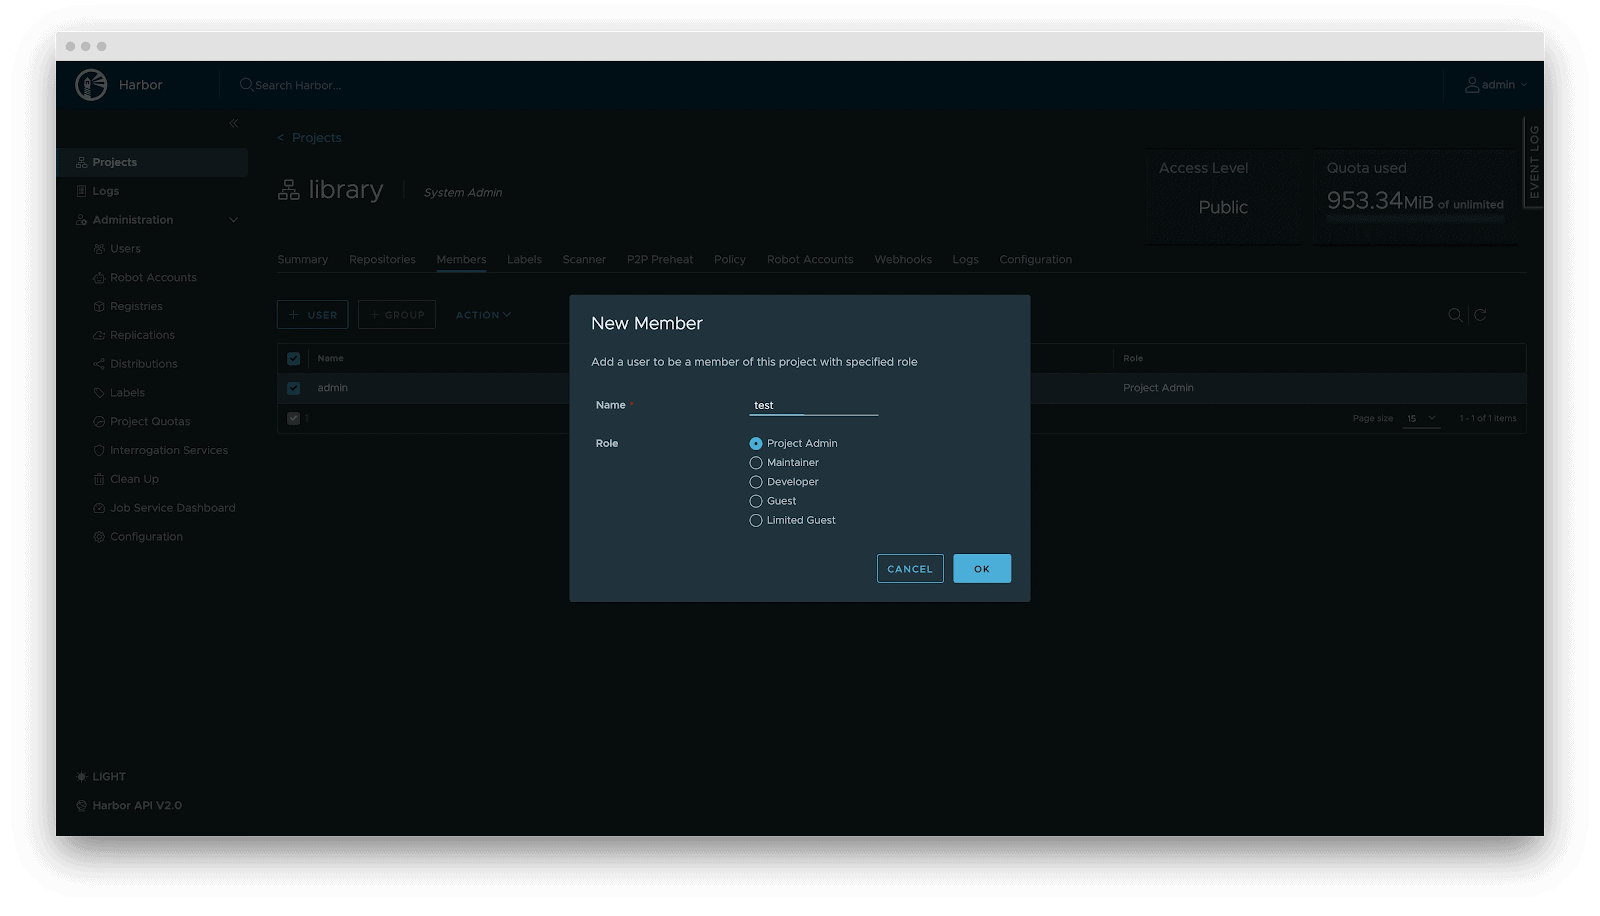
- RBAC: Fine-grained access control. Control who can PUSH (e.g., Algorithm Engineers), who can only PULL (e.g., Inference Services), and who has administrative privileges.
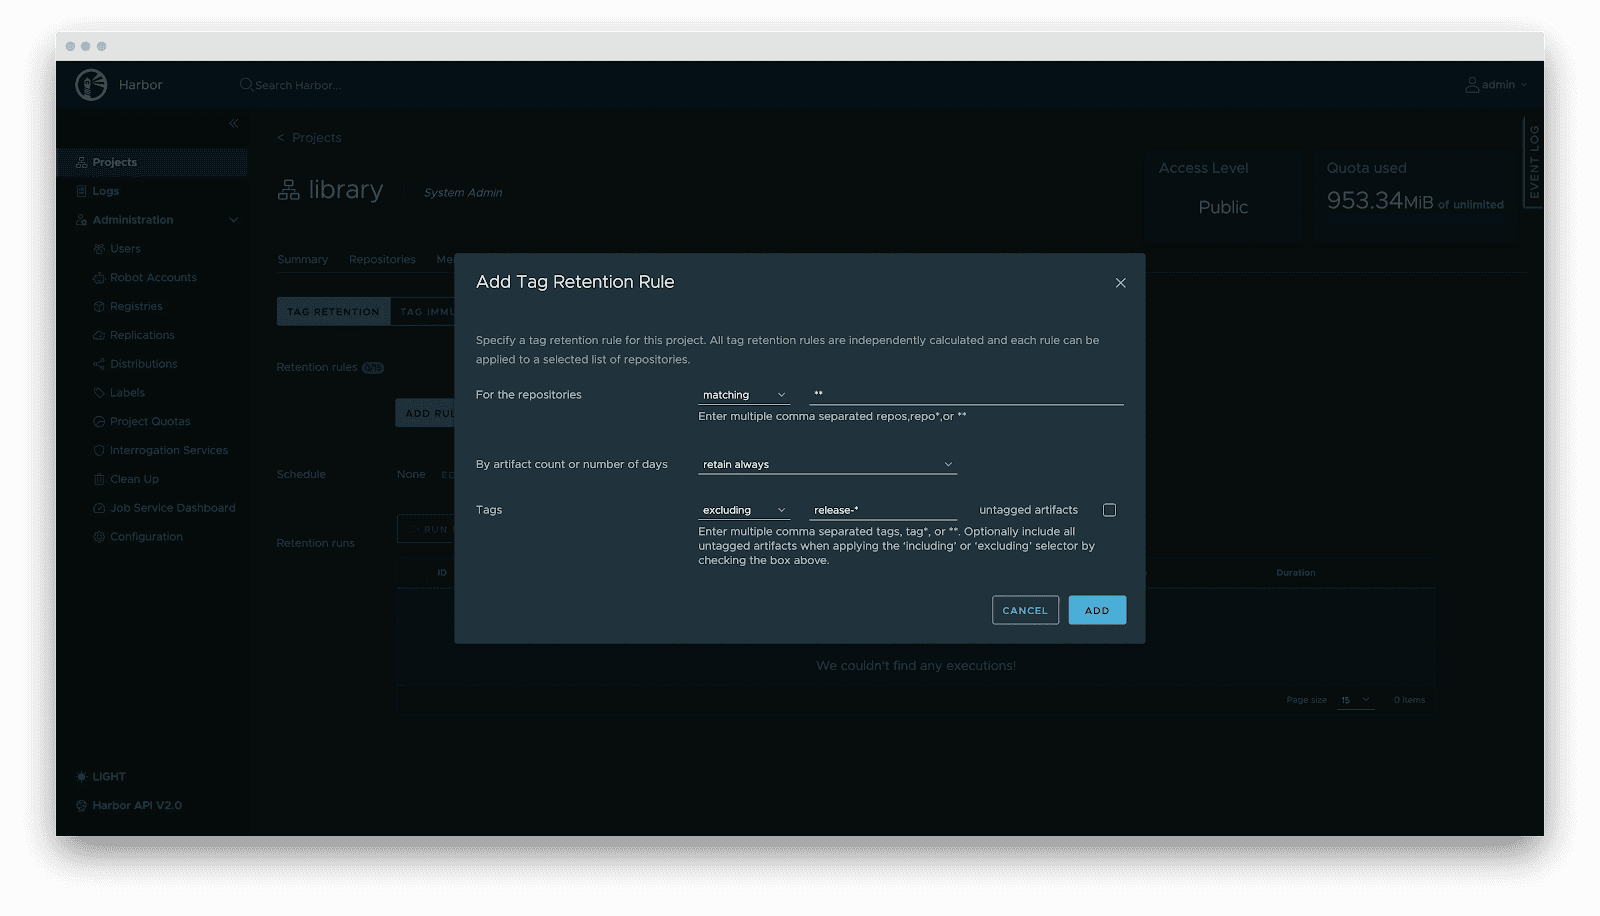
- Lifecycle management: Tag retention policies automatically purge non-release versions while locking active versions, balancing storage costs with stability.
- Supply chain security: Integration with Cosign/Notation for signing. Harbor enforces signature verification before distribution, preventing model poisoning attacks.
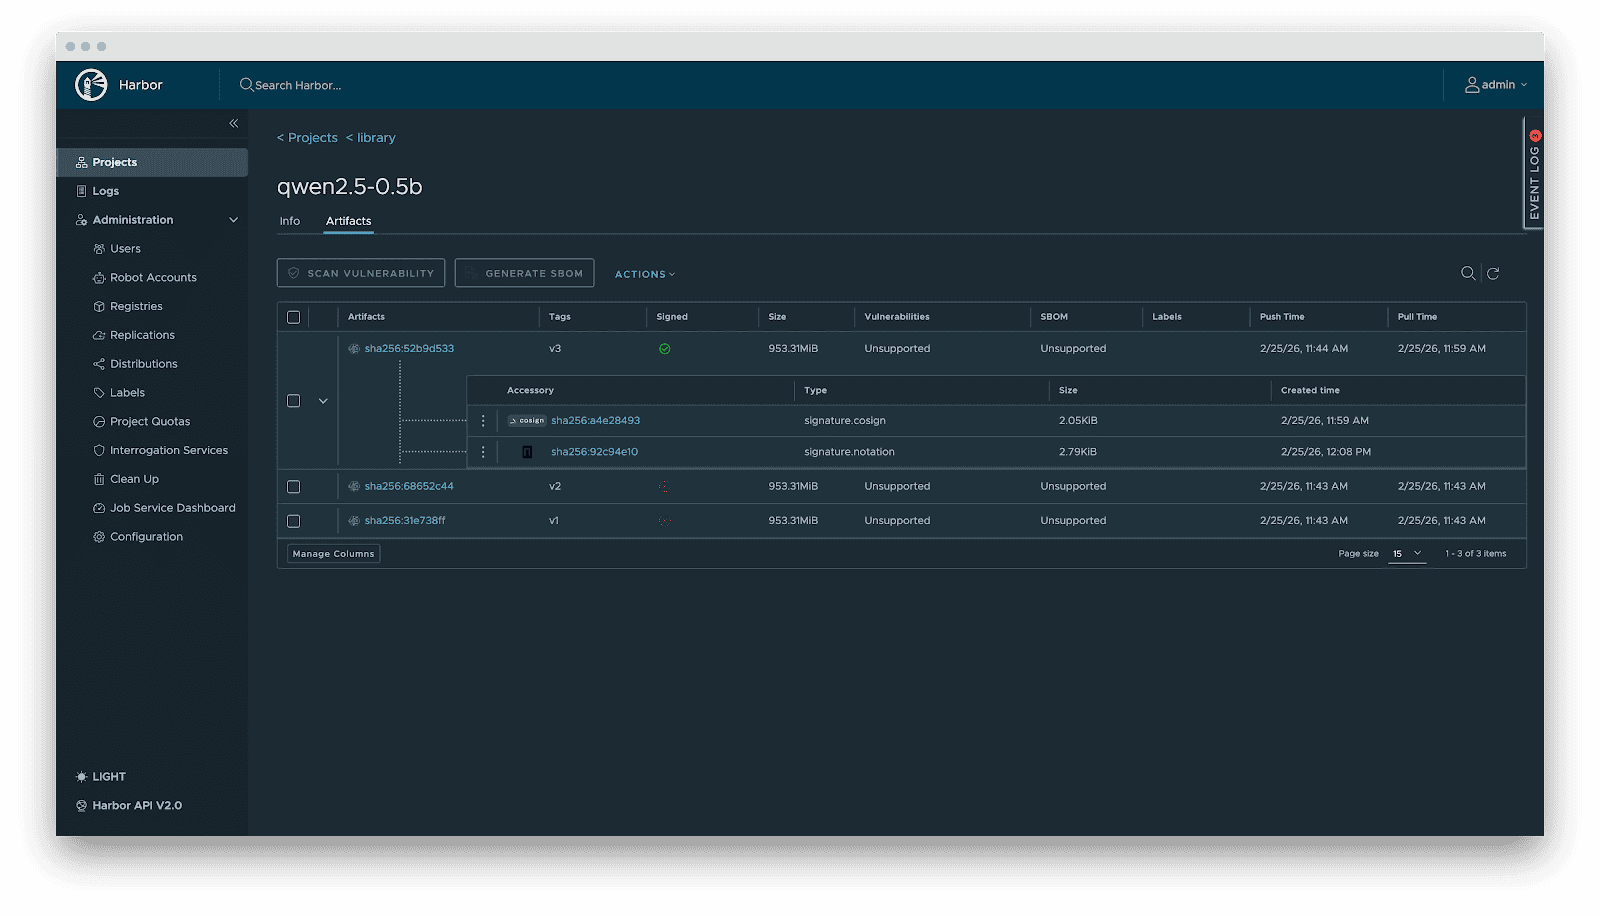
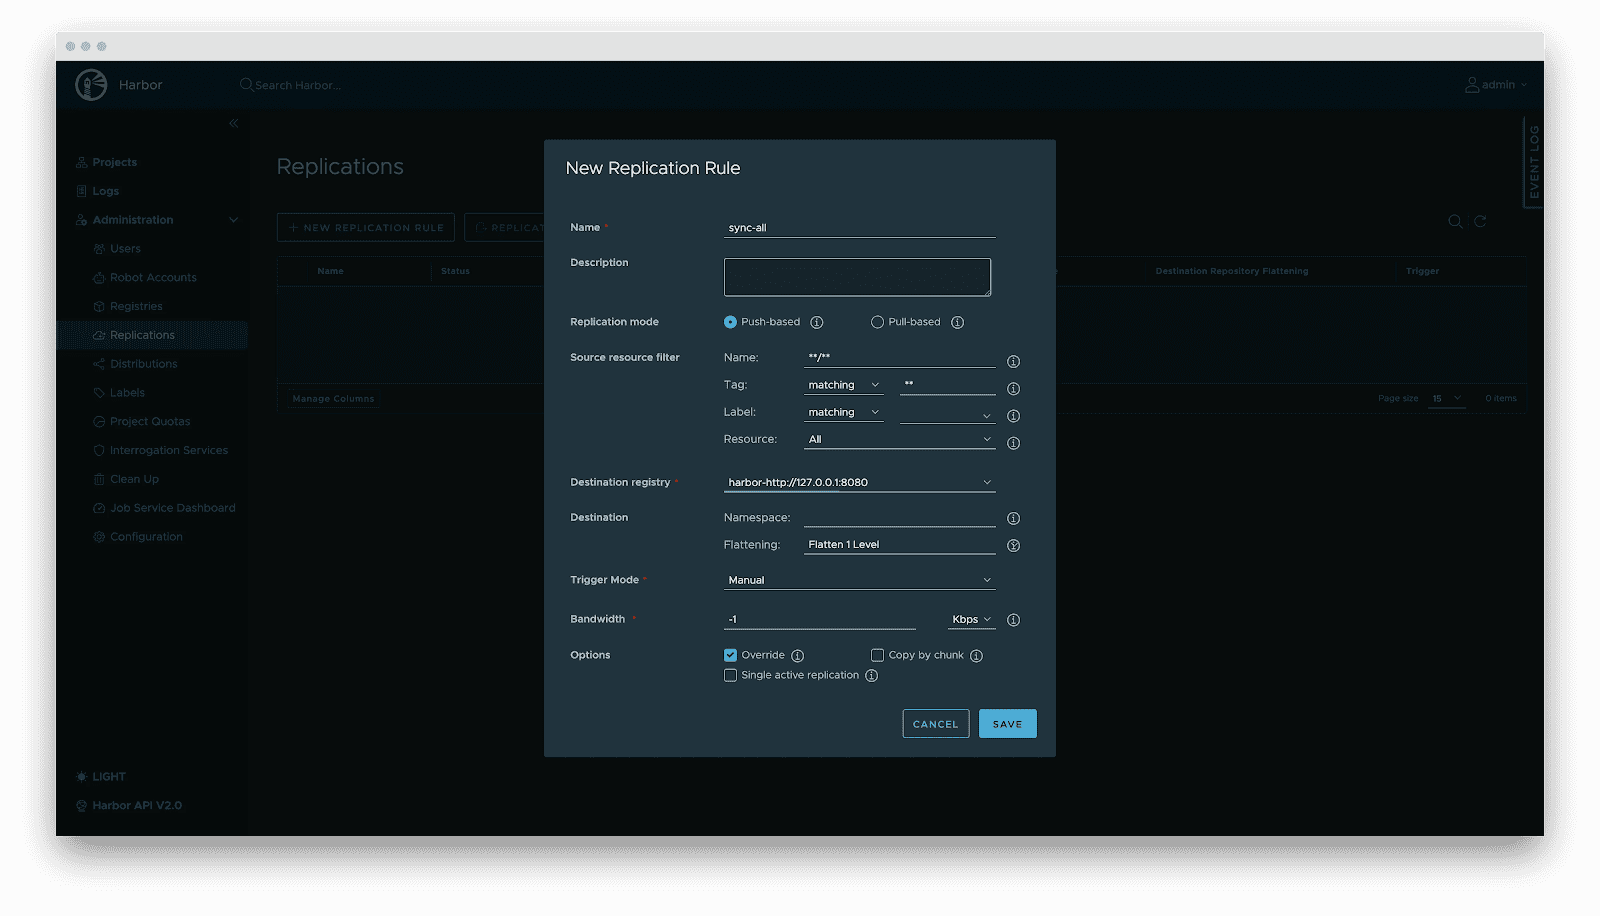
- Replication: Automated, incremental synchronization between central and edge registries or active-standby clusters.
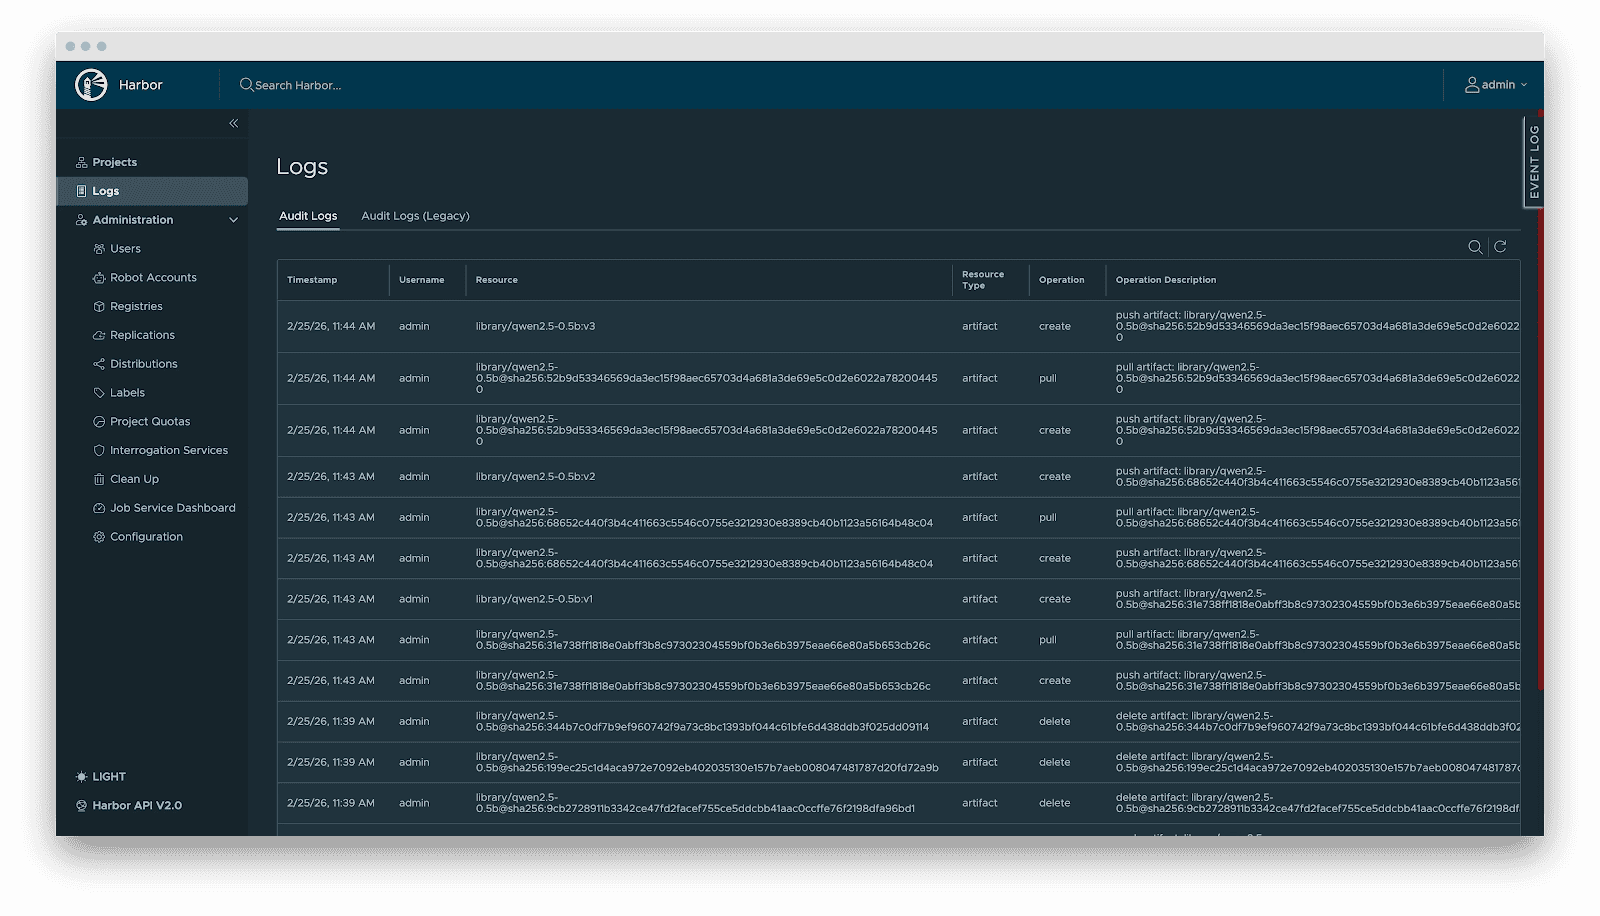
- Audit: Comprehensive logging of all artifact operations (pull/push/delete) for security compliance and traceability.
Delivery
Downloading terabyte-sized model weights directly from the origin introduces bandwidth bottlenecks. We utilize Dragonfly for P2P-based distribution, integrated with Harbor for preheating.
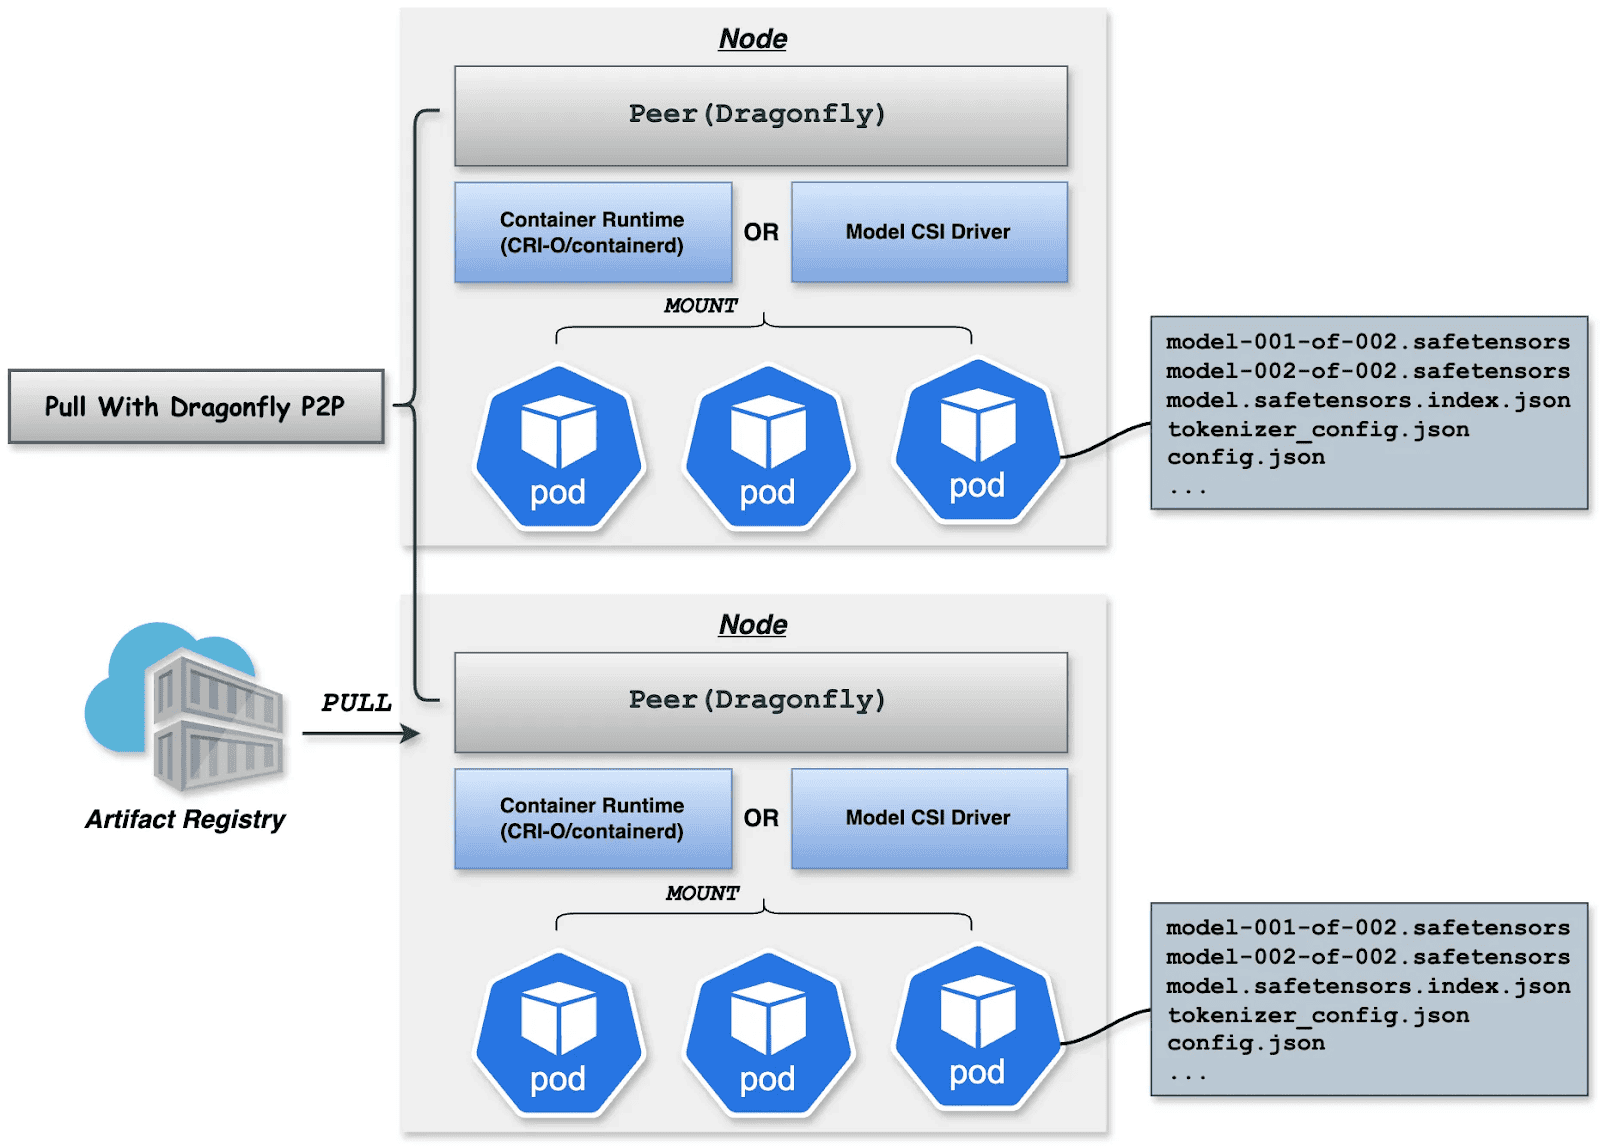
Dragonfly P2P-based distribution
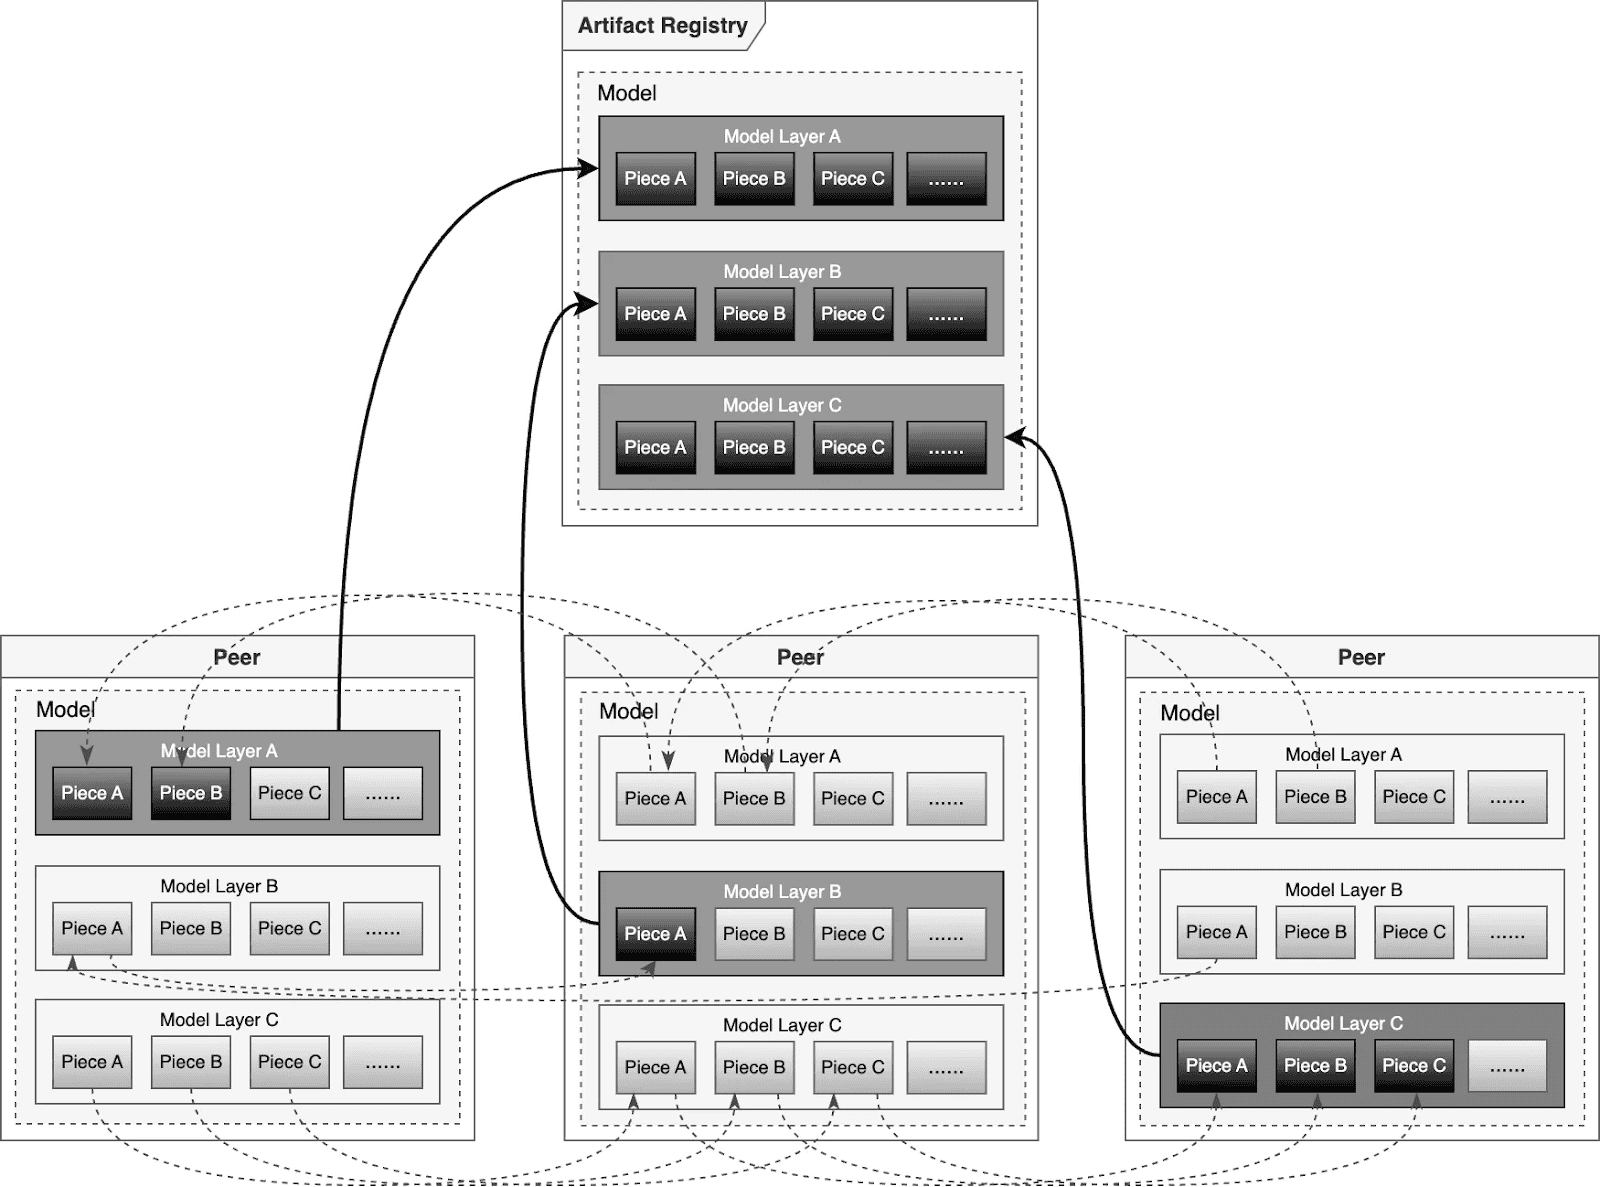
For large-scale distribution scenarios, Dragonfly has been deeply optimized based on P2P technology. Taking the example of 500 nodes downloading a 1TB model, the system distributes the initial download tasks of different layers across nodes to maximize downstream bandwidth utilization and avoid single-point congestion. Combined with a secondary bandwidth-aware scheduling algorithm, it dynamically adjusts download paths to eliminate network hotspots and long-tail latency. For individual model weight, Dragonfly splits individual model weights into pieces and fetches them concurrently from the origin. This enables streaming-based downloading, allowing users to share models without waiting for the complete file. This solution has been proven in high-performance AI clusters, utilizing 70%–80% of each node’s bandwidth and improving model deployment efficiency.
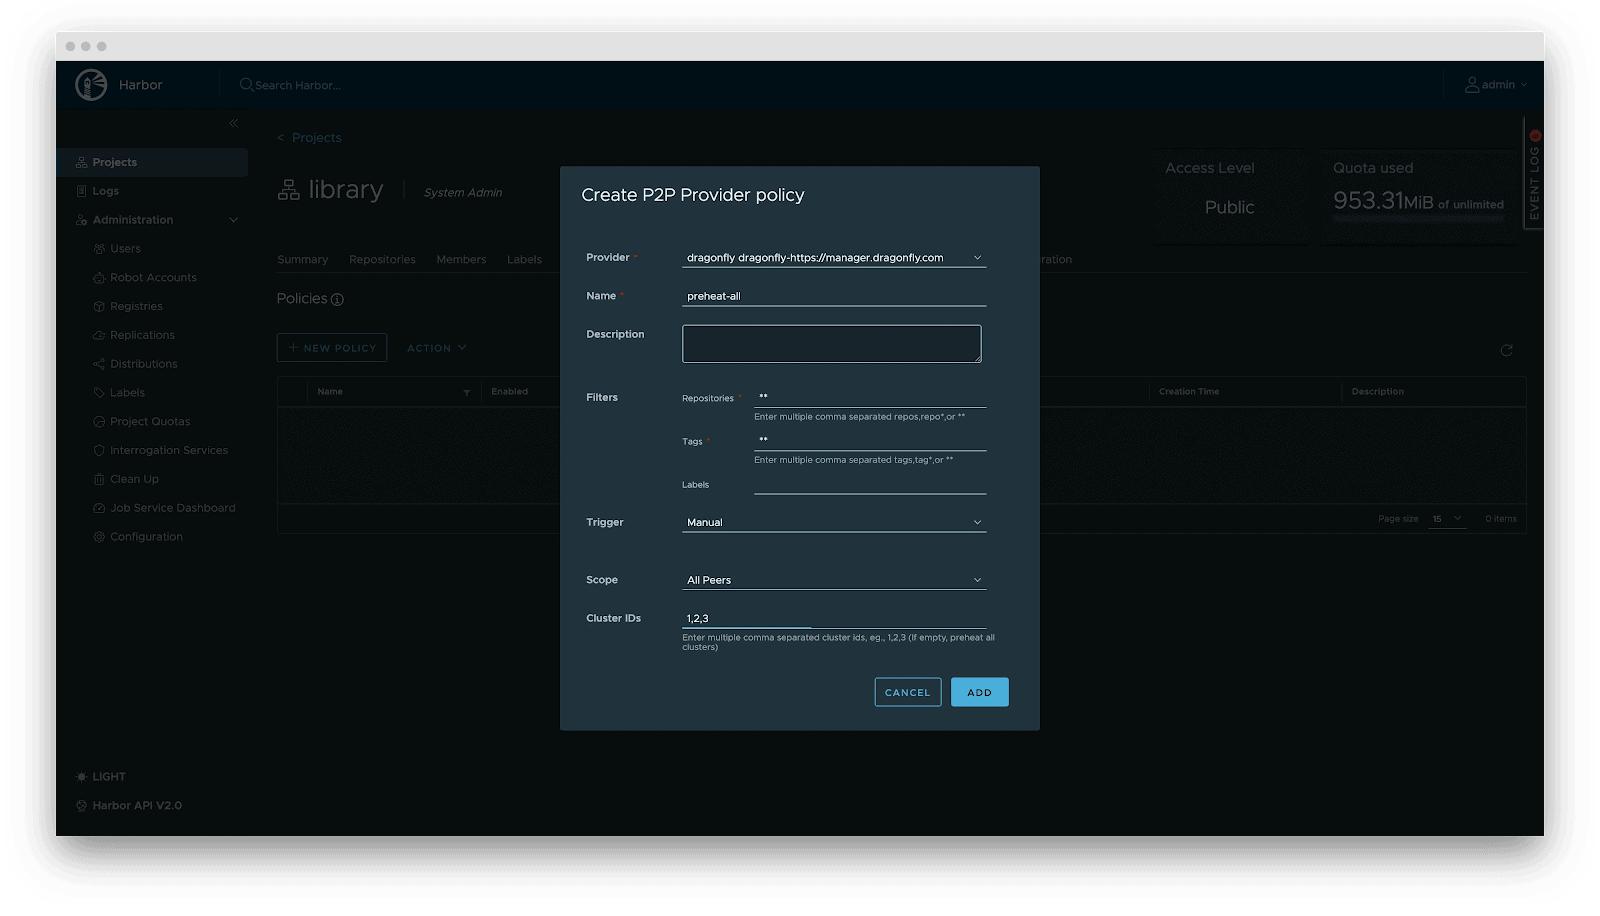
Preheating
For latency-sensitive inference services, Harbor triggers Dragonfly to distribute and cache data on target nodes before service scaling. When the instance starts, the model loads from the local disk, achieving zero network latency.
Deployment
Deployment focuses on decoupling the Model (Data) from the Inference Engine (Compute). By leveraging Kubernetes declarative primitives, the Engine runs as a Container, while the Model is mounted as a Volume. This native approach not only enables multiple Pods on the same node to share and reuse the model, saving disk space, but also leverages the preheating and P2P capabilities of Harbor & Dragonfly to eliminate the latency of pulling large model weights, significantly improving startup speed.
OCI Volumes (Kubernetes 1.31+)
Native support for mounting OCI artifacts as volumes via CRI-O/containerd. This feature was introduced as alpha in Kubernetes 1.31 (requires enabling the ImageVolume feature gate) and promoted to beta in Kubernetes 1.33 (enabled by default, no feature gate configuration needed). CRI-O specifically enhances this for LLMs by avoiding decompression overhead at mount time by storing layers uncompressed, resulting in superior performance when mounting large model files.
Step 1: Build YAML
apiVersion: v1
kind: Pod
metadata:
  name: vllm-cpu-inference
  labels:
    app: vllm
spec:
  containers:
  - name: vllm
    image: openeuler/vllm-cpu:latest
    command:
    - "python3"
    - "-m"
    - "vllm.entrypoints.openai.api_server"
    args:
    - "--model"
    - "/models"
    - "--dtype"
    - "float32"
    - "--host"
    - "0.0.0.0"
    - "--port"
    - "8000"
    - "--max-model-len"
    - "1024"
    - "--disable-log-requests"
    env:
    - name: VLLM_CPU_KVCACHE_SPACE
      value: "1"
    - name: VLLM_WORKER_MULTIPROC_METHOD
      value: "spawn"
    resources:
      requests:
        memory: "2Gi"
        cpu: "1"
      limits:
        memory: "16Gi"
        cpu: "8"
    volumeMounts:
    - name: model-volume
      mountPath: /models
      readOnly: true
    ports:
    - containerPort: 8000
      protocol: TCP
      name: http
    livenessProbe:
      httpGet:
        path: /health
        port: 8000
      initialDelaySeconds: 60
      periodSeconds: 10
      timeoutSeconds: 5
    readinessProbe:
      httpGet:
        path: /health
        port: 8000
      initialDelaySeconds: 30
      periodSeconds: 5
  volumes:
  - name: model-volume
    image:
      reference: ghcr.io/chlins/qwen2.5-0.5b:v1
      pullPolicy: IfNotPresent
---
apiVersion: v1
kind: Service
metadata:
  name: vllm-service
spec:
  selector:
    app: vllm
  ports:
  - port: 8000
    targetPort: 8000
    protocol: TCP
    name: http
  type: ClusterIP
Step 2: Deploy inference Workload
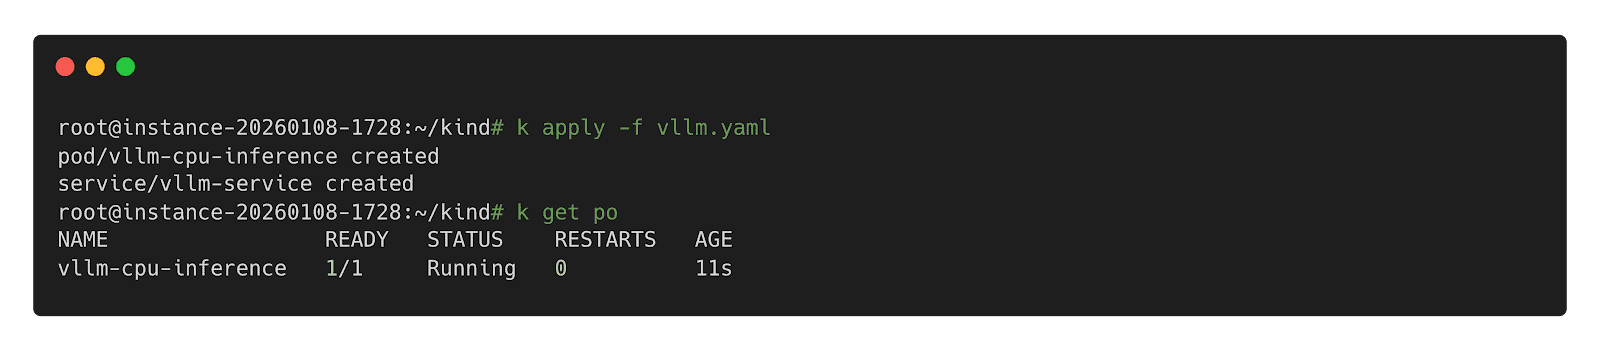
Step 3: Call Inference Workload
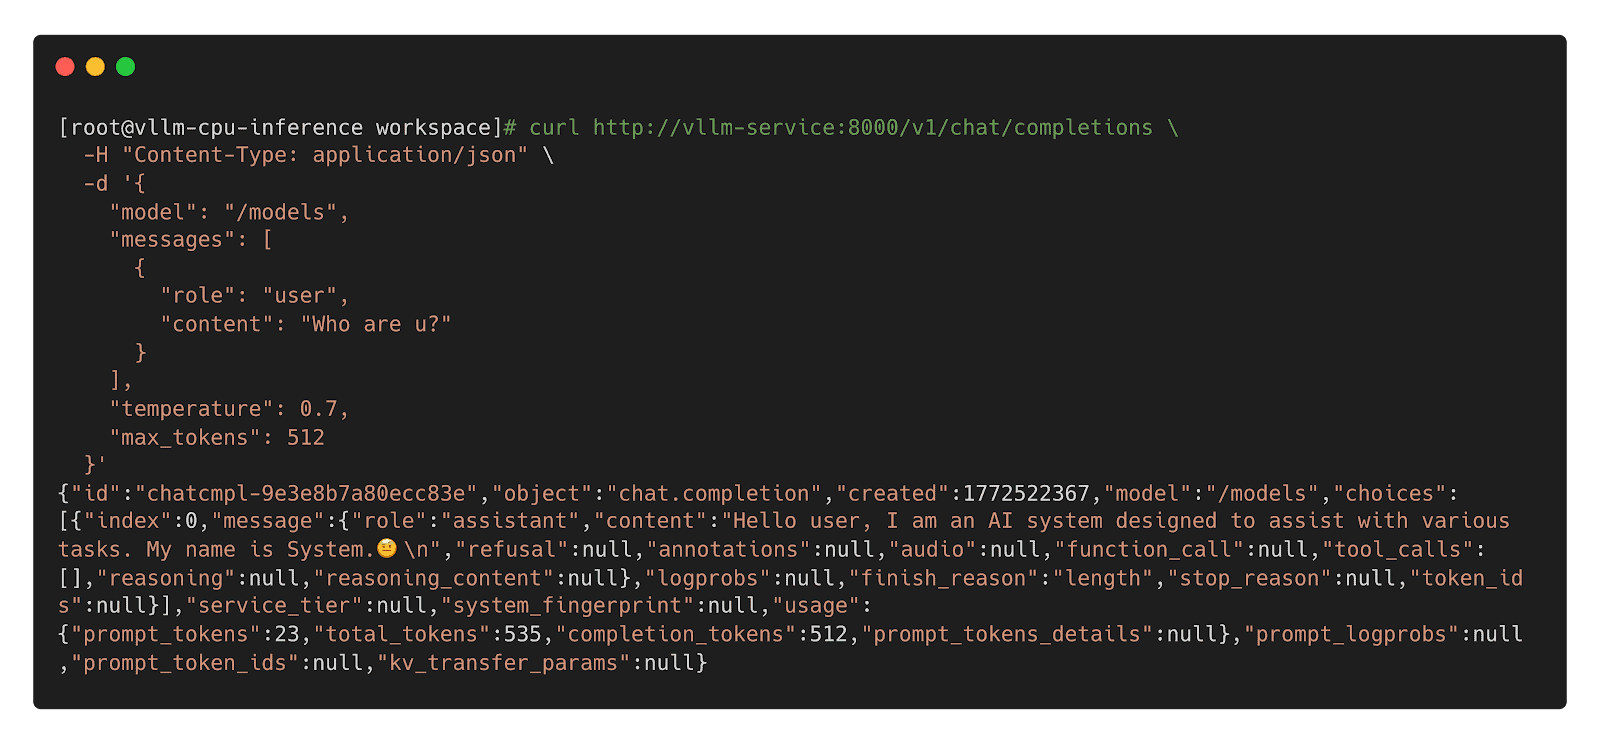
Model CSI Driver
For compatibility with Kubernetes 1.31 and older, we offer the Model CSI Driver as an interim solution to mount and deploy models as volumes. As OCI Volumes are slated for GA in Kubernetes 1.36, shifting to native OCI Volumes is recommended for the long term.
Step 1: Build YAML
apiVersion: v1
kind: Pod
metadata:
  name: vllm-cpu-inference
  labels:
    app: vllm
spec:
  containers:
  - name: vllm
    image: openeuler/vllm-cpu:latest
    command:
    - "python3"
    - "-m"
    - "vllm.entrypoints.openai.api_server"
    args:
    - "--model"
    - "/models"
    - "--dtype"
    - "float32"
    - "--host"
    - "0.0.0.0"
    - "--port"
    - "8000"
    - "--max-model-len"
    - "1024"
    - "--disable-log-requests"
    env:
    - name: VLLM_CPU_KVCACHE_SPACE
      value: "1"
    - name: VLLM_WORKER_MULTIPROC_METHOD
      value: "spawn"
    resources:
      requests:
        memory: "2Gi"
        cpu: "1"
      limits:
        memory: "16Gi"
        cpu: "8"
    volumeMounts:
    - name: model-volume
      mountPath: /models
      readOnly: true
    ports:
    - containerPort: 8000
      protocol: TCP
      name: http
    livenessProbe:
      httpGet:
        path: /health
        port: 8000
      initialDelaySeconds: 60
      periodSeconds: 10
      timeoutSeconds: 5
    readinessProbe:
      httpGet:
        path: /health
        port: 8000
      initialDelaySeconds: 30
      periodSeconds: 5
  volumes:
  - name: model-volume
    csi:
      driver: model.csi.modelpack.org
      volumeAttributes:
        model.csi.modelpack.org/reference: ghcr.io/chlins/qwen2.5-0.5b:v1
---
apiVersion: v1
kind: Service
metadata:
  name: vllm-service
spec:
  selector:
    app: vllm
  ports:
  - port: 8000
    targetPort: 8000
    protocol: TCP
    name: http
  type: ClusterIP
Step 2: Deploy Inference Workload

Step 3: Call Inference Workload
 Future
- Enhanced Preheating: Allow models to be preheated to specified nodes and querying cache distribution across nodes for model-aware pod scheduling.
- Dragonfly RDMA Acceleration: Enable Dragonfly to utilize InfiniBand or RoCE to improve the speed of distribution.
- Lazy Loading: Implement on-demand downloading of model weights to reduce startup latency.
- containerd Optimization: Enhance the OCI Volumes implementation to reduce decompression overhead for large layers.
- Model Security Scanning: Introduce deep scanning capabilities specifically designed for model weights to detect embedded malicious payloads.
- Kubernetes: https://github.com/kubernetes/kubernetes
- Harbor: https://github.com/goharbor/harbor
- Dragonfly: https://github.com/dragonflyoss/dragonfly
- CRI-O: https://github.com/cri-o/cri-o
- containerd: https://github.com/containerd/containerd
- modctl: https://github.com/modelpack/modctl
- Model CSI Driver: https://github.com/modelpack/model-csi-driver
- Model Spec: https://github.com/modelpack/model-spec
- ORAS: https://github.com/oras-project/oras
- Kubernetes – Read Only Volumes Based On OCI Artifacts: https://kubernetes.io/blog/2024/08/16/kubernetes-1-31-image-volume-source/
- Harbor – AI Model Processor: https://github.com/goharbor/community/blob/main/proposals/new/AI-model-processor.md
- Dragonfly – Load-Aware Scheduling Algorithm: https://d7y.io/docs/next/operations/deployment/applications/scheduler/#bandwidth-aware-scheduling-algorithm
- CRI-O – Add OCI Volume/Image Source Support: https://github.com/cri-o/cri-o/pull/8317
- containerd – Add OCI/Image Volume Source support: https://github.com/containerd/containerd/pull/10579
Announcing Kubescape 4.0 Enterprise Stability Meets the AI Era
We are happy to announce the release of Kubescape 4.0, a milestone bringing enterprise-grade stability and advanced threat detection to open source Kubernetes security. This version focuses on making security more proactive and scalable. It also introduces capabilities that allow AI agents to utilize Kubescape to scan clusters as well as enable security posture scanning for the AI agents themselves.
Runtime Threat Detection Reaches General Availability (GA)
The highlight of this release is the GA of our Runtime Threat Detection. After rigorous testing, we’ve achieved proven stability at scale.
The engine is powered by CEL-based detection rules. These Common Expression Language rules are highly efficient and have direct access to Kubescape Application Profiles, which act as security baselines for your workloads.
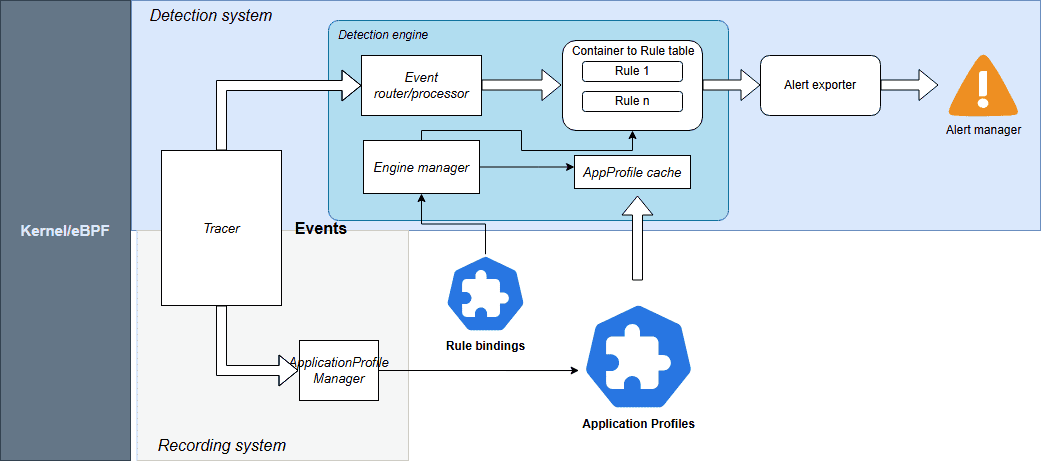
Source: Kubescpe.io
Kubescape 4.0 monitors a comprehensive suite of events including:
- System Interactions: Processes, Linux capabilities, and System calls
- Connectivity: Network and HTTP events
- Storage: File system activities
For seamless operations, Rules and RuleBindings are now managed as Kubernetes CRDs. You can export alerts to your existing stack, including AlertManager, SIEM, Syslog, Stdout, and HTTP webhooks.
Check out the Kubescape documentation for more information.
Kubescape Storage Reaches General Availability (GA)
Kubescape Storage has officially reached GA. This component leverages the Kubernetes Aggregated API, a Kubernetes-native feature, to act as a centralized repository for all security metadata.
By moving custom objects like Application Profiles, SBOMs, and vulnerability manifests into this dedicated storage layer, we’ve ensured that security data doesn’t overwhelm the standard etcd instance. This architecture has been proven to handle the demands of large-scale, high-density clusters, providing the performance required for modern enterprise environments.
For more information, check out Amir Malka’s session at Kubecon + CloudNativeCon North America 2025:
Extending Kubernetes API: The Hidden Power of Aggregated Server Objects – Amir Malka, ARMO
The Enhanced Node-Agent and Host-Sensor Deprecation
Based on community feedback regarding the complexity of node scanning, we have removed the host-sensor in Kubescape 4.0. While effective, this “pop-up” DaemonSet approach was often perceived as intrusive and difficult to monitor from a security perspective.
We have also officially removed the host-agent and integrated its capabilities directly into the node-agent. By establishing a direct API between the core Kubescape microservices and the node-agent, we’ve eliminated the need for ephemeral, high-privilege Pods. This architectural shift allows you to maintain a cleaner cluster environment with only one agent to manage, making your security posture both more stable and easier to audit.
Kubescape Enters the AI Era
With the launch of Kubescape 4.0, we are addressing the unique challenges of the AI-native era by looking at security from two equally important perspectives. This focus is critical, as the same cloud native principles that scale modern infrastructure are foundational for the next generation of inference pipelines and intelligent, agentic AI systems. We like to think of this as the “two sides of the AI security coin”: using Kubescape to empower AI agents with cybersecurity capabilities and using Kubescape to secure those same agents.
Empowering AI Security Sidekicks
As AI inference becomes the next major cloud native workload and Kubernetes evolves into the platform for intelligent systems, Kubescape 4.0 introduces a KAgent-native plug-in, allowing AI assistants to analyze Kubernetes security posture directly from the cluster. This plug-in provides the following capabilities to the AI agent:
- Security Scanning: AI agents can list and inspect vulnerability manifests for CVEs and review configuration scans to identify RBAC issues or missing security contexts.
- Detailed Remediation: Agents can pull specific guidance to fix vulnerabilities.
- Runtime Observability: Using ApplicationProfiles and NetworkNeighborhoods, AI assistants can look at how containers behave in real life, like what system calls they make, what files they access, and how they communicate over the network.
This integration enables an AI agent to become a true security sidekick; assisting humans to interpret complex security states and make informed decisions.
Scanning the AI Posture
AI agents are beginning to gain more autonomy, meaning their infrastructure must be secured. We need robust security guardrails to stop agents from exploiting them for high-risk actions like unauthorized access or deleting production data. Kubescape 4.0 introduces security posture scanning specifically for KAgent, the CNCF Sandbox project for AI orchestration.
Since KAgent creates direct pathways between AI models and enterprise infrastructure, misconfigurations can be high-risk. Our new analysis identifies 42 security-critical configuration points across KAgent’s CRDs. We are introducing 15 Rego-based controls to detect issues such as:
- Empty security contexts in default deployments
- Missing NetworkPolicies
- Over-privileged controller-wide namespace watching
By applying these rigorous standards, we are ensuring that the “brains” of your AI operations are as secure as the workloads they manage.
Compliance
In the continuously evolving cloud native landscape, robust governance and consistent, auditable compliance are the critical foundations that allow for safe and sustainable innovation. Kubescape continues to help keep your clusters compliant with the latest industry standards:
- CIS Benchmark Updates: Support for versions 1.12 (Vanilla Kubernetes) and 1.8 (EKS, AKS).
Community Corner
We’d like to welcome our new maintainer, Amir Malka, and thank our emeritus maintainers, David Wertenteil and Craig Box, for their contributions over the years.
To join the Kubescape community and find information on how you can ask questions, join in the conversation, and contribute, visit the link here.
If you are a Kubescape user, we’d love to hear from you. Please reach out if you would like to share an interesting use case with the community or add yourself to our list of adopters.
Istio Brings Future Ready Service Mesh to the AI Era with New Ambient Multicluster, Gateway API Inference Extension and More
New beta capabilities and experimental support aim to simplify service mesh adoption while expanding Istio’s role in next-generation AI infrastructure
Key Highlights:
- Istio announced ambient multicluster beta, Gateway API Inference Extension beta and experimental agentgateway support at KubeCon + CloudNativeCon Europe 2026.
- New updates simplify multicluster operations and introduce optimized model routing to support AI inference on Kubernetes.
- Updates from Istio benefit platform engineers, operators and application teams running distributed and AI workloads.
KUBECON + CLOUDNATIVECON EUROPE, AMSTERDAM—25 MARCH, 2025—The Cloud Native Computing Foundation® (CNCF®), which builds sustainable ecosystems for cloud native software, today announced that Istio has launched a host of new features designed to meet the rising needs of modern, AI-driven infrastructure while reducing operational complexity. Updates include the beta release of ambient multicluster support, a beta release of Gateway API Inference Extension and experimental support for agentgateway as a component of the Istio data plane.
CNCF’s Annual Cloud Native Survey found that 66% of organizations are running GenAI workloads on Kubernetes, yet only 7% achieve daily deployments for AI workloads. The data also shows that innovators are nearly three times more likely than explorers to run service mesh in production, signaling that maturity in cloud native practices correlates with advanced traffic management and security adoption.
As AI inference models increasingly run on Kubernetes clusters, projects such as Istio are valuable in securing, routing and observing that traffic. New beta features, such as the simplified Ambient Multicluster, are designed to eliminate the complexity that often impedes organizations from reaching daily deployment velocity for these critical AI workloads. These updates reflect a broader shift toward platform engineering teams building guardrails and infrastructure needed to safely operate the rising demands of AI workloads.
“After nine years, Istio continues to evolve to meet users where they are and where they’re headed,” said Chris Aniszczyk, CTO, CNCF. “These new updates signal Istio’s commitment to being the service mesh of the future for agentic workloads and more.”
Istio’s latest updates are designed to meet the rising demands of AI workloads and simplify operations for all users. Key features include:
- Ambient Multicluster (beta): Ambient Multicluster extends Istio’s ambient mode to support traffic routing across multiple clusters without sidecars, simplifying the deployment and management of service mesh. The result is a simplified approach for teams running applications across regions or clouds for scale and resilience.
- Gateway API Inference Extension (beta): Built as an enhancement to the Gateway API, the extension integrates machine learning inference directly into mesh traffic flows, offering a consistent developer experience (DevEx) that streamlines operations for platform teams familiar with the Kubernetes standard.
- Agentgateway: Experimental support for agentgateway: Experimental support for agentgateway, as part of the Istio data plane, reflects the community’s focus on exploring more flexible, lightweight traffic handling to keep pace with AI development. Originally created by Solo.io and now a Linux Foundation project, agentgateway is designed to help manage dynamic AI-driven traffic patterns. Through this experimental integration, Istio aims to provide a foundation for emerging AI use cases while maintaining compatibility with existing service mesh deployments.
“Istio’s evolution reflects where cloud native infrastructure is headed,” said Keith Mattix, Istio maintainer. “Users want simpler multicluster operations and they want to run AI workloads with confidence. These releases deliver both while staying true to Istio’s roots.”
Together, these updates position Istio to support a shift already underway in cloud native environments. As AI workloads increasingly run on Kubernetes, service mesh technologies like Istio provide the networking, security and observability needed to manage that traffic at scale, supporting everything from model training and inference to agentic systems.
Learn more about Istio and join the community: https://istio.io/
About Cloud Native Computing Foundation
Cloud native computing empowers organizations to build and run scalable applications with an open source software stack in public, private, and hybrid clouds. The Cloud Native Computing Foundation (CNCF) hosts critical components of the global technology infrastructure, including Kubernetes, Prometheus, and Envoy. CNCF brings together the industry’s top developers, end users, and vendors and runs the largest open source developer conferences in the world. Supported by nearly 800 members, including the world’s largest cloud computing and software companies, as well as over 200 innovative startups, CNCF is part of the nonprofit Linux Foundation. For more information, please visit www.cncf.io.
The Linux Foundation has registered trademarks and uses trademarks. For a list of trademarks of The Linux Foundation, please see our trademark usage page. Linux is a registered trademark of Linus Torvalds.
Media Contact
Haley White
The Linux Foundation
Announcing the release of KubeVirt v1.8
The KubeVirt Community is happy to announce the release of v1.8, which aligns with Kubernetes v1.35.
This is the third release since we started our VEP (Virt Enhancement Proposal) process and, after some shaky starts and concerted iterating, we are really starting to see it settle and find a rhythm in the community. We have had a real boom in proposals for this release, and that trend is likely to continue. It’s wonderful to see new contributors coming forward with exciting ideas and engage with the project to see them through.
You can read the full release notes in our user-guide, but we have included some highlights in this blog.
For those of you at KubeCon this week, we have a whole bunch of talks, as well as a project kiosk, which we have listed on our events wiki.
We are also running our first in-person event: KubeVirt Summit Live at the Cloud Native Theatre on Thursday March 26th.
### SIG Compute
The Confidential Computing Working Group has introduced improvements to support Intel TDX Attestation in KubeVirt; confidential VMs can now certify that they are running on confidential hardware (Intel TDX currently).
Another major milestone is the introduction of Hypervisor Abstraction Layer, which enables KubeVirt to integrate multiple hypervisor backends beyond KVM, while still maintaining the current KVM-first behaviour as default.
And because good things happen in threes, we’ve also enabled AI and HPC workloads in VMs to achieve near-native performance with the introduction of PCIe NUMA topology awareness alongside other resource improvements.
### SIG Networking
The `passt` binding has been promoted from a plugin to a core binding. This binding is a significant improvement to an earlier implementation.
Also, you can now live update NAD references without requiring VM restart, allowing you to change a VM’s backing network without disrupting the guest.
And we have decoupled KubeVirt from NAD definitions to reduce API calls made by virt-controller, removing a performance bottleneck for VM activation at scale and improving security by removing permissions. Users should be aware that this is a deprecating process and prepare accordingly.
### SIG Storage
The big news on the storage front is two new features: ContainerPath volume and Incremental Backup with CBT.
ContainerPath volumes allow you to map container paths for VM storage and improve portability and configuration options. This provides an escape hatch for cloud provider credential injection patterns.
Incremental Backup with Changed Block Tracking (CBT) leverages QEMU’s and libvirt backup capabilities providing storage agnostic incremental VM backups. By capturing only modified data, the solution eliminates reliance on specific CSI drivers, allowing for faster backup windows and a drastically reduced storage footprint. This not only ensures storage freedom but also minimizes cluster network traffic for peak efficiency.
### SIG Scale and Performance
There have been a few test improvements rolled out in SIG Scale and Performance. First, we have increased the KWOK performance test to 8000 VMIs. The results have shown the kubevirt control-plane performs well even as VMI counts grow. On the scale side, when comparing the 100 VMI job to 8000 VMI job, we see some expected memory increases. The average virt-api memory grows from 140MB to 170MB (+30MB) and average virt-controller memory grows from 65MB to 1400MB (+1335MB).
To determine the memory scaling per Virtual Machine Instance (VMI), we calculate the rate of change on the control-plane in the 100 real VMIs and 8000 KWOK VMIs. This estimates the incremental memory cost for each additional VMI added to the system.
ComponentTotal Memory Increase 100 to 8000 (Δ)Memory Scale per VMI (MB)Memory Scale per VMI (KB)virt-api30 MB0.0038 MB3.89 KBvirt-controller1335 MB0.1690 MB173.04 KBWe will continue to refine these measurements as they are still estimates and may have some incorrect measurements. Our goal is to eventually publish this along this our comprehensive list of performance and scale benchmarks for each release, which is here.
### Thanks!
A lot of work from a huge amount of people go into these releases. Some contributions are small, such as raising a bug or attending our community meeting, and others are massive, like working on a feature or reviewing PRs. Whatever your part: we thank you.
We had a huge amount of features and the next release is looking to be larger still. If you’re interested in contributing and being a part of this great project, please check out our contributing guide and our community membership guidelines. Reviewing PRs is a great way to learn and gain experience, but it can sometimes be daunting. If you’d like to be involved but aren’t sure, reach out on our Slack or mailing list; we have some wonderful people in the community who can help you find your feet.
Tekton Becomes a CNCF Incubating Project
The CNCF Technical Oversight Committee (TOC) has voted to accept Tekton as a CNCF incubating project.
What is Tekton?
Tekton is a powerful and flexible open source framework for creating continuous integration and delivery (CI/CD) systems that allows developers to build, test, and deploy across multiple cloud providers and on-premises systems by abstracting away the underlying implementation details.
While widely adopted for CI/CD, Tekton serves as a general-purpose, security-minded, Kubernetes-native workflow engine. Its composable primitives (Steps, Tasks and Pipelines) allow developers to orchestrate any type of sequential or parallel workload on Kubernetes. Tekton provides a standard, Kubernetes-native interface for defining these workflows, making them portable and reusable.
Tekton’s Key Milestones
The project has matured into a leading framework for Kubernetes-native CI/CD, reaching its stable v1.0 release for the core Pipelines component.
By joining the CNCF, Tekton aligns itself more closely with the ecosystem it powers. It integrates deeply with other CNCF projects like Argo CD (for GitOps) and SPIFFE/SPIRE (for identity), and also Sigstore via OpenSSF (for signing and verification), creating a robust supply chain security story.
Tekton is widely adopted in the industry and used by companies like Puppet and Ford Motor Company. Additionally, Tekton powers major commercial CI/CD offerings, including, but not limited to: Red Hat OpenShift Pipelines and IBM Cloud Continuous Delivery.
A Message from the Tekton Team
“One of the accomplishments I’m most proud of is the broad adoption of Tekton across open source projects, commercial products, and in-house platforms. Seeing teams rely on it in production and build on it within their own ecosystems has been especially rewarding. As a Kubernetes-native project that integrates naturally with other CNCF technologies, Tekton has benefited from close collaboration within the Cloud Native Computing Foundation community. I’m looking forward to deepening those partnerships, learning from our peers across CNCF projects, and meeting more Tekton users who are shaping what cloud native delivery looks like in practice.”
— Andrea Frittoli, Tekton Governing Board Member
“What I’m most proud of is how Tekton has shown that CI/CD can be a true Kubernetes-native primitive, not just another layer on top. Seeing projects like Shipwright—itself a CNCF project—and Konflux build on Tekton as their foundation validates that vision. Building all of this alongside a diverse, multi-vendor community with Red Hat, Google, IBM, and many individual contributors has been one of the most rewarding open source experiences of my career. I’m looking forward to what comes next. The future of Tekton is Trusted Artifacts changing how tasks share data, a simpler developer experience through Pipelines as Code, and deeper collaboration with CNCF projects like Sigstore and Argo CD. Tekton is fundamentally a Kubernetes project, and CNCF is its natural home.”
— Vincent Demeester, Tekton Governing Board Member
Support from TOC Sponsors
The CNCF Technical Oversight Committee (TOC) provides technical leadership to the cloud native community. It defines and maintains the foundation’s technical vision, approves new projects, and stewards them across maturity levels. The TOC also aligns projects within the overall ecosystem, sets cross-cutting standards and best practices and works with end users to ensure long-term sustainability. As part of its charter, the TOC evaluates and supports projects as they meet the requirements for incubation and continue progressing toward graduation.
“Tekton has proven itself as core infrastructure for Kubernetes-native delivery. Its move to incubation reflects strong multi-vendor governance and deep alignment with CNCF projects focused on GitOps, identity and software supply chain security.”
— Chad Beaudin, TOC Sponsor, Cloud Native Computing Foundation
“Tekton’s composable design and broad adoption make it an important part of the cloud native workflow landscape. The TOC’s vote recognizes a healthy contributor community and a clear roadmap.”
— Jeremy Rickard, TOC Sponsor, Cloud Native Computing Foundation
The Main Components of Tekton
- Pipelines: The core building blocks (Tasks, Pipelines, Workspaces) for defining CI/CD workflows.
- Triggers: Allows pipelines to be instantiated based on events (like Git pushes or pull requests).
- CLI: A command-line interface for interacting with Tekton resources.
- Dashboard: A web-based UI for visualizing and managing pipelines.
- Chains: A supply chain security tool that automatically signs and attests artifacts built by Tekton.
Community Highlights
These community metrics signal strong momentum and healthy open source governance. For a CNCF project, this level of engagement builds trust with adopters, ensures long-term sustainability and reflects the collaborative innovation that defines the cloud native ecosystem. Tekton’s notable milestones include:
- 11,000+ GitHub Stars (across all repositories)
- 5,000+ Pull Requests
- 2,500+ Issues
- 600+ Contributors
- 1.0 Stable Release of Pipelines
The Future of Tekton
The Tekton roadmap focuses on stability, security and scalability. Key initiatives from the project board and enhancement proposals (TEPs) include:
- Supply Chain Security: Enhancing Tekton Chains to meet SLSA Level 3 requirements by default, including better provenance for build artifacts.
- Trusted Artifacts: Introducing a secure and efficient way to pass data between tasks without relying on shared storage (PVCs), significantly improving performance and isolation (TEP-0139).
- Concise Syntax: Exploring less verbose syntax for referencing remote tasks and pipelines to improve developer experience (TEP-0154).
- Advanced Scheduling: Integrating with Kueue for better job queuing and priority management of PipelineRuns.
- Tekton Results: Moving the Results API to stable to provide long-term history and query capabilities for PipelineRuns and TaskRuns.
- Catalog Evolution: Transitioning reusable tasks to Artifact Hub for better discoverability and standardized distribution.
- Pipelines as Code: Continued investment in Git-based workflows, improving the “as code” experience for defining and managing pipelines.
For more details, see the Tekton Project Board and approved TEPs (Tekton Enhancement Proposals).
As a CNCF-hosted project, Tekton is committed to the principles of open source, neutrality and collaboration. We invite global developers and ecosystem partners to join us in enabling data to flow and be efficiently used freely anywhere, anytime. For more information on maturity requirements for each level, please visit the CNCF Graduation Criteria.
Fluid Becomes a CNCF Incubating Project
The CNCF Technical Oversight Committee (TOC) has voted to accept Fluid as a CNCF incubating project.
What is Fluid?
Kubernetes provides a data access layer through the Container Storage Interface (CSI), enabling workloads to connect to storage systems. However, certain use cases often require additional capabilities such as dataset versioning, access controls, preprocessing, dynamic mounting, and data acceleration.
To help address these needs, Nanjing University, Alibaba Cloud, and the Alluxio community introduced Fluid, a cloud native data orchestration and acceleration system that treats “elastic datasets” as a first-class resource. By adding a data abstraction layer within Kubernetes environments, Fluid enhances data flow and management for data-intensive workloads.
Fluid’s vision is Data Anyway, Anywhere, Anytime:
- Anyway: Fluid focuses on data accessibility. Storage vendors can flexibly and simply integrate various storage clients without needing deep or extensive knowledge of Kubernetes CSI or Golang programming.
- Anywhere: Fluid facilitates efficient data access across diverse infrastructure by supporting heterogeneous computing environments (cloud, edge, and serverless). It accelerates access to various storage systems like HDFS, S3, GCS, and CubeFS by utilizing caching engines such as Alluxio, JuiceFS, and Vineyard.
- Anytime: Runtime dynamic adjustment of data sources allows data scientists to add and remove storage data sources on-demand in Kubernetes environments without service interruption.
Fluid’s Key Milestones and Ecosystem Development
Fluid originated as a joint project from Nanjing University, Alibaba Cloud, and the Alluxio community in September 2020. The project aims to provide efficient, elastic, and transparent data access capabilities for data-intensive AI applications in cloud native environments. In May 2021, Fluid was officially accepted as a CNCF sandbox project.
Since joining the CNCF, Fluid has rapidly grown, continuously releasing multiple important updates, achieving significant breakthroughs in key capabilities such as elastic data cache scaling, unified access to heterogeneous data sources, and application-transparent scheduling, while also improving the operational efficiency of AI and big data workloads on cloud native platforms.
Fluid’s core design concepts and technological innovations have received high-level academic recognition, with related results published in top conferences and journals in the database and computer systems fields, such as IEEE TPDS 2023.
In December 2024, at KubeCon + CloudNativeCon North America, CNCF released the 2024 Technology Landscape Radar Report, where Fluid, along with projects such as Kubeflow, was listed as “Adopt,”becoming one of the de facto standards in the cloud native AI and big data field.
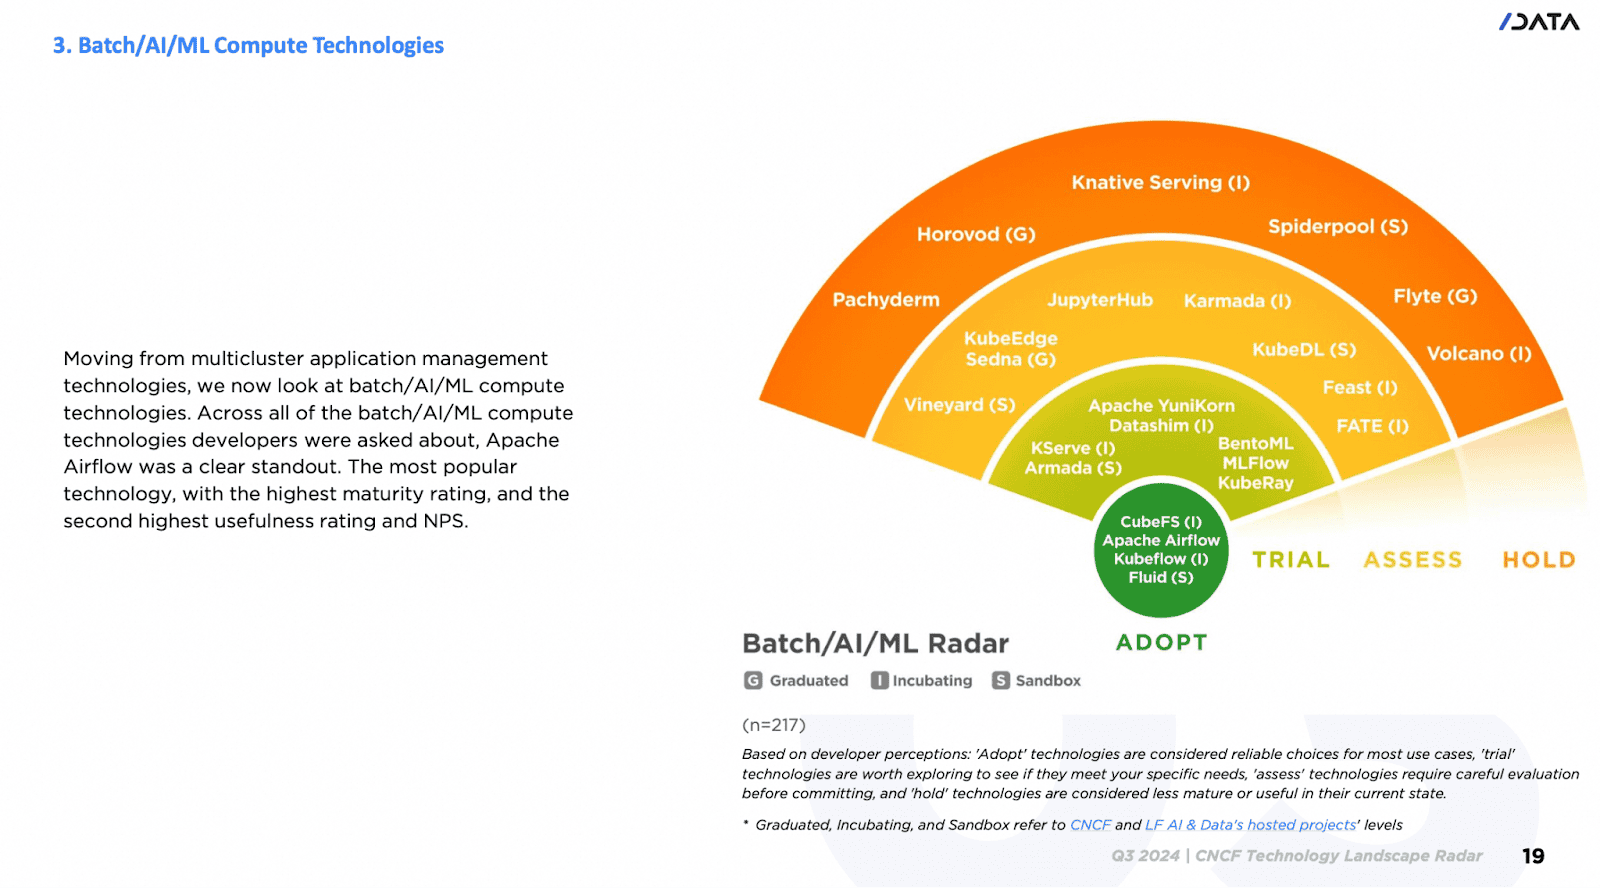
Now, Fluid has been widely adopted across multiple industries and regions worldwide, with users covering major cloud service providers, internet companies, and vertical technology companies. Some Fluid users include Xiaomi, Alibaba Group, NetEase, China Telecom, Horizon, Weibo, Bilibili, 360, Zuoyebang, Inceptio Technology, Huya, OPPO, Unisound, DP Technology, JoinQuant, among others. Use cases cover a wide range of application scenarios, including, but not limited to, Artificial Intelligence Generated Content (AIGC), large models, big data, hybrid cloud, cloud-based development machine management, and autonomous driving data simulation.
A Word from the Maintainers
“We are deeply honored to see Fluid promoted to an incubating project. Our original intention in initiating Fluid was to fill the gap between compute and storage in cloud native architectures, allowing data to flow freely in the cloud like ‘fluid.’ The vibrant community development and widespread user adoption validate our vision. We will continue to drive the evolution of cloud native data orchestration technology, especially when it comes to exploring intelligent scheduling and orchestration of KVCache for large model inference scenarios and dedicating ourselves to making data serve various applications more efficiently and intelligently.”
— Gu Rong (Nanjing University), Chair and Co-Founder of the Fluid Community
“From sandbox to incubation, the concept of ‘caches also needing elasticity’ has gained widespread recognition. In the future, we will continue to drive Fluid toward becoming the standard for cloud native data orchestration, allowing data scientists to focus on model innovation.”
— Che Yang (Alibaba Cloud), Fluid Community Maintainer and Co-Founder
“Fluid is a key bridge to connecting AI computing frameworks and distributed storage systems. Seeing Fluid grow from a sandbox to an incubating project makes us extremely proud. This milestone proves that building a standardized data abstraction layer on Kubernetes is keeping up with industry trends.”
— Fan Bin (Alluxio Inc.), Alluxio Open Source Community Maintainer
Support from TOC Sponsors
The TOC provides technical leadership to the cloud native community. It defines and maintains the foundation’s technical vision, approves new projects, and stewards them across maturity levels. The TOC also aligns projects within the overall ecosystem, sets cross-cutting standards and best practices, and works with end users to ensure long-term sustainability. As part of its charter, the TOC evaluates and supports projects as they meet the requirements for incubation and continue progressing toward graduation.
“Fluid’s progression to incubation reflects both its technical maturity and the clear demand we’re seeing for stronger data orchestration in cloud native environments. As AI and data-intensive workloads continue to grow on Kubernetes, projects like Fluid help bridge compute and storage in a way that is practical, scalable, and community-driven. The TOC looks forward to supporting the project’s continued evolution within the CNCF ecosystem.”
— Alex Chircop, CNCF TOC Member
“Fluid has demonstrated a strong level of maturity that aligns well with CNCF Incubation expectations. Adopter interviews showcase that Fluid has been deployed successfully in large-scale production environments for several years and provides standardized APIs that enable multiple applications to efficiently access and cache diverse datasets. Additionally, Fluid benefits from a healthy, engaged community, with a roadmap clearly shaped by adopter feedback.”
— Katie Gamanji, CNCF TOC Member
Main Components in Fluid
- Dataset Controller: Responsible for dataset abstraction and management, maintaining the binding relationship and status between data and underlying storage.
- Application Scheduler: The application scheduling component is responsible for perceiving data cache location information and scheduling application pods to the most suitable nodes.
- Runtime Plugins: Pluggable runtime interface responsible for deployment, configuration, scaling, and failure recovery of specific caching engines (such as Alluxio, JuiceFS, Vineyard, etc.), with excellent extensibility.
- Webhook: Utilizes the Mutating Admission Webhook mechanism to automatically inject sidecar or volume mount information into application pods, achieving zero intrusion into applications.
- CSI Plugin: Enables lightweight, transparent dataset mounting support for application pods, enabling them to access cached or remote data via local file system paths.
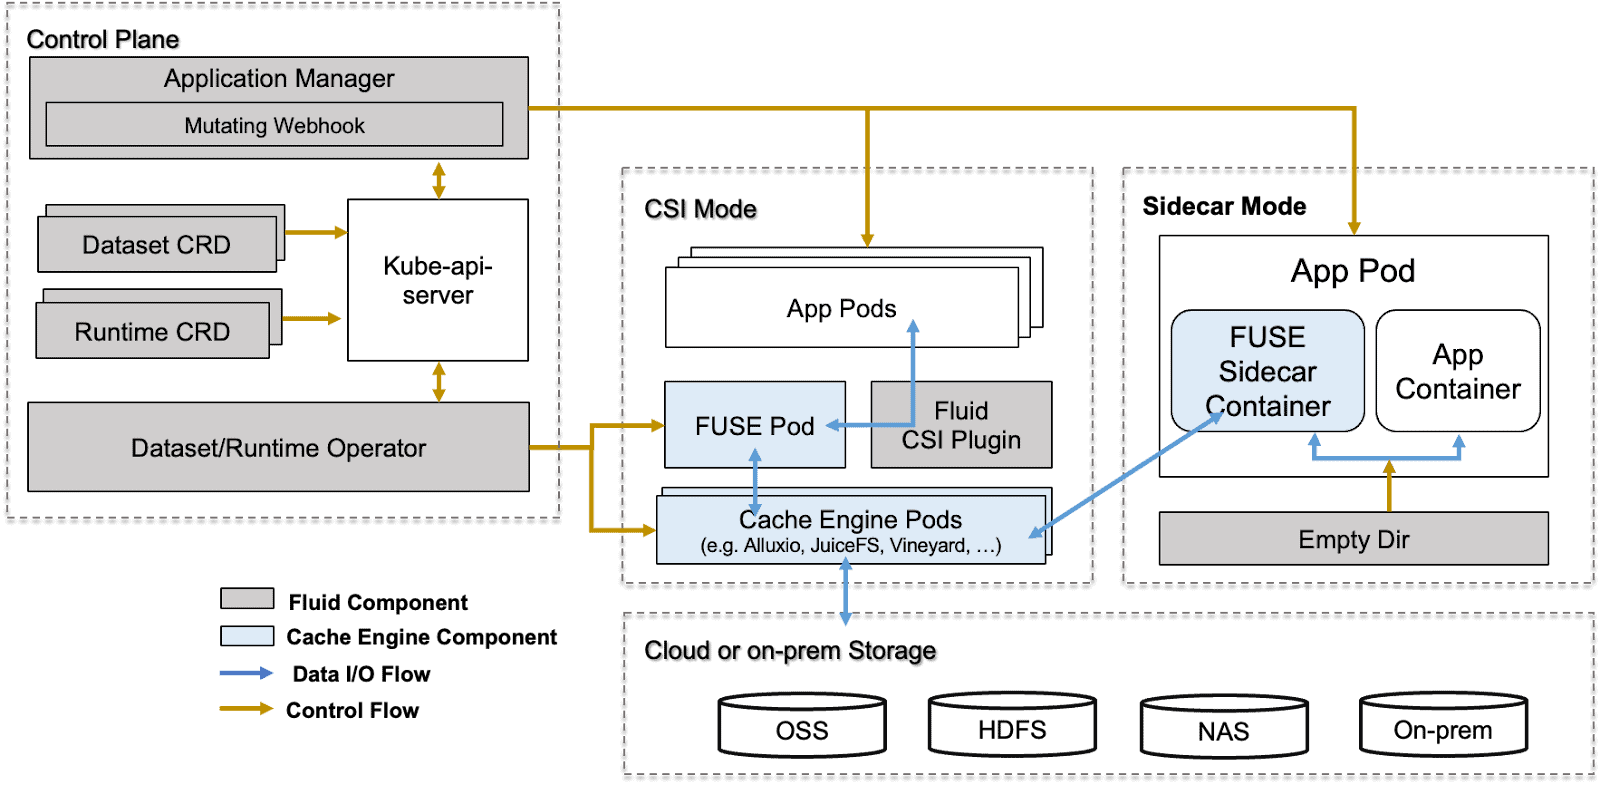
Community Highlights
These community metrics signal strong momentum and healthy open source governance. For a CNCF project, this level of engagement builds trust with adopters, ensures long-term sustainability, and reflects the collaborative innovation that defines the cloud native ecosystem.
- 1.9k GitHub Stars
- 116 pull requests
- 250 issues
- 979 contributors
- 28 Releases
The Journey Continues
Becoming a CNCF incubating project is a turning point for Fluid’s journey. Fluid will continue to deepen its data orchestration capabilities for generative AI and big data scenarios. To meet the exponential growth demands of GenAI applications, Fluid’s next goal is to evolve into an intelligent elastic data platform, allowing users to focus on model innovation and data value mining, while Fluid handles the underlying data distribution, cache acceleration, resource management, and elastic scaling.
As a CNCF incubating project, Fluid will continue to uphold the principles of open source, neutrality, and collaboration, working together with global developers and ecosystem partners to enable data to flow and be efficiently used freely anywhere, anytime.
Hear from Users
“Fluid’s Anytime capability allows our data scientists to self-service data switching without restarting Pods, truly achieving data agility. This is the core reason we chose Fluid over a self-built solution.”
— Liu Bin, Technical Lead at DP Technology
“Fluid’s vendor neutrality and cross-namespace cache sharing capabilities help us avoid cloud vendor lock-in and save approximately 40% in cross-cloud bandwidth costs. It has been deeply integrated into all of our data workflows.”
— Zhao Ming, Head of Horizon AI Platform
“In LLM model inference, remote Safetensors file reading often leads to low I/O utilization. Fluid’s intelligent prefetching and local caching technology allows us to fully saturate bandwidth without modifying code, fully unleashing GPU computing power.”
— Zhang Xiang, Head of NetEase MaaS
As a CNCF-hosted project, Fluid is committed to the principles of open source, neutrality and collaboration. We invite global developers and ecosystem partners to join us in enabling data to flow and be efficiently used freely anywhere, anytime. For more information on maturity requirements for each level, please visit the CNCF Graduation Criteria.
Cloud Native Computing Foundation Announces Kyverno’s Graduation
Kyverno reaches graduation after demonstrating broad enterprise adoption as platform teams adopt declarative governance
Key Highlights:
- Kyverno graduates from the Cloud Native Computing Foundation after demonstrating production readiness and strong adoption.
- Kyverno’s declarative policy-as-code solution makes it easier for platform and security teams to define and enforce guardrails across Kubernetes and cloud native environments.
- Since joining CNCF in 2020, the Kyverno community has grown significantly, expanding from 574 GitHub stars to more than 9,000 and attracting contributors and end users worldwide.
KUBECON + CLOUDNATIVECON NORTH EUROPE, AMSTERDAM, The Netherlands – March 24, 2026 – The Cloud Native Computing Foundation® (CNCF®), which builds sustainable ecosystems for cloud native software, today announced the graduation of Kyverno, a Kubernetes-native policy engine that enables organizations to define, manage and enforce policy-as-code across cloud native environments.
Originally created by Nirmata and contributed to the CNCF in 2020, Kyverno (which means “to govern” in Greek) has achieved the highest maturity level after demonstrating widespread production adoption and significant community growth. The project’s declarative policy-as-code solution makes it easier for platform and security teams to define and enforce guardrails across Kubernetes and cloud native environments.
“Kyverno’s graduation highlights how important policy-as-code has become for organizations running cloud native in production at scale,” said Chris Aniszczyk, CTO of CNCF. “The project makes it easier for platform teams to enforce governance and security practices using familiar Kubernetes constructs, and the strong community behind Kyverno shows how critical this capability is across the ecosystem.”
Since joining the CNCF, Kyverno has experienced exponential growth and adoption across the Kubernetes ecosystem. The project has grown from 574 to more than 9,000 GitHub stars, and Kyverno continues to attract a growing number of contributors and end users worldwide. Today, Kyverno helps platform and security teams enforce policy, security and operational guardrails across some of the world’s largest Kubernetes environments. Organizations such as Bloomberg, Coinbase, Deutsche Telekom, Groww, LinkedIn, Spotify, Vodafone and Wayfair publicly rely on Kyverno to help secure and manage their Kubernetes platforms.
The project offers multiple ways for organizations to integrate policy management into their workflows, including running as a Kubernetes admission controller, command-line interface (CLI), container image or software development kit (SDK). While Kyverno began as a Kubernetes-native admission controller, it has evolved into a broader policy engine used across the cloud native stack. Declarative policies can now be applied to a wide range of payloads and enforcement points. It integrates deeply with the broader CNCF ecosystem and is commonly used alongside projects such as Argo CD, Backstage, Flux and Kubernetes to help platform teams implement policy-driven governance as part of modern GitOps and platform engineering practices.
To achieve graduation, Kyverno successfully completed a third party security audit and a comprehensive security assessment led by CNCF TAG Security & Compliance. The project also passed a formal governance review, demonstrating mature open source practices. Further, the community introduced contributor guidelines addressing the responsible use of AI-assisted development tools.
The CNCF Technical Oversight Committee (TOC) provides technical leadership to the cloud native community, defining its vision and stewarding projects through maturity levels up to graduation. Kyverno’s graduation was supported by TOC sponsor Karena Angell, who conducted a thorough technical due diligence.
“Graduation is reserved for projects that demonstrate strong governance, sustained community growth and widespread production use,” said Karena Angell, chair of the Technical Oversight Committee, CNCF. “Kyverno met that bar through its technical maturity, security posture and the growing number of organizations relying on it to manage policy across Kubernetes environments.”
With its latest release, Kyverno has fully adopted Common Expression Language (CEL), aligning with the future direction of Kubernetes admission controls for improved performance and enhanced expressiveness. Upcoming releases will focus on extending policy enforcement to additional control points across the cloud native stack, including support for artificial intelligence and Model Context Protocol (MCP) gateways. These innovations will help organizations apply policy-as-code consistently across infrastructure, applications and emerging AI-driven workloads.
“As AI adoption accelerates, policy-as-code provides the essential guardrails for autonomous governance at scale without stifling innovation,” said Jim Bugwadia, Kyverno co-creator and CEO of Nirmata. “We built Kyverno to champion developer agility and self-service, and we are honored by its massive growth and success within the CNCF ecosystem.”
Learn more about Kyverno and join the community: https://kyverno.io
Supporting Quotes
“Kyverno has become a core part of how I help platform teams take control of their Kubernetes environments. What used to require manual intervention and custom scripts is now policy-as-code that teams can own without learning a separate language. For organisations running Kubernetes at scale, Kyverno’s graduation reflects what I’ve seen firsthand – it’s production-ready, battle-tested and it makes platform teams faster.”
– Steve Wade, Founder at Platform Fix and Ex-Technical Advisory Board Member at Cisco
“At Deutsche Telekom, Kyverno has played an important role in helping our platform teams implement Kubernetes-native policy management in a scalable and developer-friendly way. Its declarative approach to policy enforcement allows us to embed security, compliance and operational best practices directly into our Kubernetes environments without adding unnecessary complexity for application teams. The project’s strong community, rapid innovation and focus on usability have made Kyverno a valuable tool for organizations operating Kubernetes at scale. We’re excited to see the project reach this stage and look forward to its continued growth in the cloud native ecosystem.”
– Mamta Bharti, VP of Engineering at Deutsche Telekom
“Kyverno has become a critical component of LinkedIn’s Kubernetes admission control pipeline, enforcing consistent security and configuration policies across 230+ clusters with 500K+ nodes. Its YAML-native approach means our platform teams can author and maintain policies without learning a new language. Kyverno has proven its reliability at enterprise scale, handling over 20K admission requests per minute under stress without degradation.”
– Shan Velleru, Senior Software Engineer at LinkedIn
About Cloud Native Computing Foundation
Cloud native computing empowers organizations to build and run scalable applications with an open source software stack in public, private, and hybrid clouds. The Cloud Native Computing Foundation (CNCF) hosts critical components of the global technology infrastructure, including Kubernetes, Prometheus, and Envoy. CNCF brings together the industry’s top developers, end users, and vendors and runs the largest open source developer conferences in the world. Supported by nearly 800 members, including the world’s largest cloud computing and software companies, as well as over 200 innovative startups, CNCF is part of the nonprofit Linux Foundation. For more information, please visit www.cncf.io.
###
The Linux Foundation has registered trademarks and uses trademarks. For a list of trademarks of The Linux Foundation, please see our trademark usage page. Linux is a registered trademark of Linus Torvalds.
Media Contact
Haley White
The Linux Foundation
CNCF and SlashData Report Finds Platform Engineering Tools Maturing as Organizations Prepare for AI-Driven Infrastructure
New CNCF Technology Radar survey shows which cloud native tools developers view as mature and ready for broad adoption
Key Highlights:
- CNCF and SlashData release findings from the Q1 2026 CNCF Technology Radar survey based on responses from more than 400 professional developers.
- CNCF and SlashData’s new report highlights which cloud native platform engineering tools developers who were surveyed view as mature, useful and ready for broad adoption.
- Helm, Backstage and kro are the three technologies placed in the ‘Adopt’ position of the application delivery technology radar, based on survey responses.
- Hybrid platform approaches are emerging as the dominant model for AI workflows, reflecting how organizations are adapting existing developer platforms to support AI workloads.
AMSTERDAM, KUBECON + CLOUDNATIVECON EUROPE– March 24, 2026 – The Cloud Native Computing Foundation® (CNCF®), which builds sustainable ecosystems for cloud native software, released new findings from the Q1 2026 CNCF Technology Radar report with SlashData, uncovering how developers are evaluating platform engineering technologies for workflow automation, application delivery, security and compliance management.
The survey findings provide an overview of how cloud native teams select internal platform tooling as organizations scale application delivery and prepare infrastructure for artificial intelligence (AI) workloads and increasingly automated development environments.
“Cloud native platforms have reached a point where developers are not just experimenting but standardizing on CNCF projects that make software delivery reliable at scale,” said Chris Aniszczyk, CTO, CNCF. “What’s especially notable about this research is how organizations are extending those same platforms to support AI workloads, showing how cloud native is the base layer of powering the next era of applications.”
Platform Engineering Shapes AI Workflow Strategies
The report explores how organizations structure internal developer platforms (IDPs) and how these decisions influence their approach to AI workflows.
- 28% of organizations report having a dedicated platform engineering team responsible for internal platforms.
- The most common IDP model, reported by 41% of organizations, is multi-team collaboration for managing platform capabilities.
- 35% of organizations report using a hybrid platform to integrate AI workloads, combining existing developer platforms with specialized AI tooling.
These survey findings suggest that many organizations are integrating AI capabilities directly into their cloud native platforms, rather than creating entirely new infrastructure stacks.
Workflow Automation Tools Show Strong Developer Confidence
In the workflow automation category, developers identify several technologies as reliable options for production environments, placing ArgoCD, Armada, Buildpacks, GitHub Actions, Jenkins in the ‘Adopt’ category.
- GitHub Actions received high recommendations across maturity and usefulness metrics, with 91% of developers claiming that they would recommend it to peers.
- Jenkins demonstrated strong maturity scores, reflecting its long standing role in CI/CD
- Developers gave Karmada and other newer tools high maturity ratings. Karmada achieved the highest usefulness rating among workflow automation tools.
The report also highlights that emerging tools are attracting developer interest, even as they continue to mature, suggesting strong developer enthusiasm for multicluster management solutions despite the perception that the technology is still evolving.
Security and Compliance Tooling Becomes Core Platform Infrastructure
According to the survey findings, security and compliance technologies are emerging as core components of modern developer platforms. Developers placed cert-manager, Keycloak, Open Policy Agent (OPA) in the ‘Adopt’ category.
- cert-manager received the highest maturity ratings, with 87% of developers rating it four to five stars for stability and reliability.
- Tools addressing emerging areas such as software supply chain security are gaining attention but remain early in their maturity cycle. For example, in-toto and Sigstore showed lower maturity ratings with little negative sentiment.
These findings suggest that developers are still evaluating how these solutions fit into their development pipelines.
Application Delivery Platforms Continue to Standardize
In the application delivery category, Backstage, Helm, and kro were placed in the ‘adopt’ position, reflecting strong developer confidence in these projects.
- Helm received the highest maturity ratings among application delivery tools, with 94% of developers giving it the greatest number of four- and five-star ratings for reliability and stability.
- Helm’s widespread usage across the ecosystem reinforces its role as a foundational component of Kubernetes application deployment.
- Backstage and kro performed strongly in usefulness ratings.
These findings indicate continued developer demand for tools that simplify Kubernetes complexity and improve developer experience across internal platforms.
“Developers are increasingly evaluating tools based on how well they fit into their internal platform architectures,” said Liam Bollmann-Dodd, principal market research consultant at SlashData. “What we see in this data is those technologies gaining traction are the ones that are reducing operational friction while enabling teams to standardize application delivery and management.”
Methodology
In Q4 2025, more than 400 professional developers using cloud native technologies were surveyed about their experiences with workflow automation, application delivery and security and compliance management tools. Respondents evaluated technologies they were familiar with based on their maturity, usefulness and the likelihood of recommending them.
Additional Resources:
- Download the full Technology Radar report
- Learn more about CNCF projects at https://www.cncf.io/projects/
About Cloud Native Computing Foundation
Cloud native computing empowers organizations to build and run scalable applications with an open source software stack in public, private, and hybrid clouds. The Cloud Native Computing Foundation (CNCF) hosts critical components of the global technology infrastructure, including Kubernetes, Prometheus, and Envoy. CNCF brings together the industry’s top developers, end users, and vendors and runs the largest open source developer conferences in the world. Supported by nearly 800 members, including the world’s largest cloud computing and software companies, as well as over 200 innovative startups, CNCF is part of the nonprofit Linux Foundation. For more information, please visit www.cncf.io.
About SlashData
SlashData is an analyst firm with more than 20 years of experience in the software industry, working with the top Tech brands. SlashData helps platform and engineering leaders make better product, marketing and strategy decisions through best-in-class research, benchmarks, and foresight into how developers, tools, and software are changing.
###
The Linux Foundation has registered trademarks and uses trademarks. For a list of trademarks of The Linux Foundation, please see our trademark usage page. Linux is a registered trademark of Linus Torvalds.
Media Contact
Haley White
The Linux Foundation
Welcome llm-d to the CNCF: Evolving Kubernetes into SOTA AI infrastructure
We are thrilled to announce that llm-d has officially been accepted as a Cloud Native Computing Foundation (CNCF) Sandbox project!
As generative AI transitions from research labs to production environments, platform engineering teams are facing a new frontier of infrastructure challenges. llm-d is joining the CNCF to lead the evolution of Kubernetes and the broader CNCF landscape into State of the Art (SOTA) AI infrastructure, treating distributed inference as a first-class cloud native workload. By joining the CNCF, llm-d secures the trusted stewardship and open governance of the Linux Foundation, giving organizations the confidence to build upon a truly neutral standard.
Launched in May 2025 as a collaborative effort between Red Hat, Google Cloud, IBM Research, CoreWeave, and NVIDIA, llm-d was founded with a clear vision: any model, any accelerator, any cloud. The project was joined by industry leaders AMD, Cisco, Hugging Face, Intel, Lambda and Mistral AI and university supporters at the University of California, Berkeley, and the University of Chicago.
“At Mistral AI, we believe that optimizing inference goes beyond just the engine, and requires solving challenges like KV cache management and disaggregated serving to support next-generation models such as Mixture of Experts (MoE). Open collaboration on these issues is essential to building flexible, future-proof infrastructure. We’re supporting this effort by contributing to the llm-d ecosystem, including the development of a DisaggregatedSet operator for LeaderWorkerSet (LWS), to help advance open standards for AI serving.” – Mathis Felardos, Inference Software Engineer, Mistral AI
What llm-d brings to the CNCF landscape
The CNCF is the natural home for solving complex workload orchestration challenges. AI serving is highly stateful and latency-sensitive, with request costs varying dramatically based on prompt length, cache locality, and model phase. Traditional service routing and autoscaling mechanisms are unaware of this inference state, leading to inefficient placement, cache fragmentation, and unpredictable latency under load. llm-d solves this by providing a pre-integrated, Kubernetes-native distributed inference framework that bridges the gap between high-level control planes (like KServe) and low-level inference engines (like vLLM). llm-d plans to work with the CNCF AI Conformance program to ensure critical capabilities like disaggregated serving are interoperable across the ecosystem.
By building on open APIs and extensible gateway primitives, llm-d introduces several critical capabilities to the CNCF ecosystem:
- Inference-Aware Traffic Management: Acting as a primary implementation of the Kubernetes Gateway API Inference Extension (GAIE), llm-d utilizes the Endpoint Picker (EPP) for programmable, prefix-cache-aware routing.
- Native Kubernetes Orchestration: Leveraging primitives like LeaderWorkerSet (LWS), llm-d orchestrates complex multi-node replicas and wide expert parallelism, transforming bespoke AI infrastructure into manageable cloud native microservices.
- Prefill/Decode Disaggregation: llm-d addresses the resource-utilization asymmetry between prompt processing and token generation by disaggregating these phases into independently scalable pods.
Advanced State Management: The project introduces hierarchical KV cache offloading across GPU, TPU, CPU, and storage tiers.
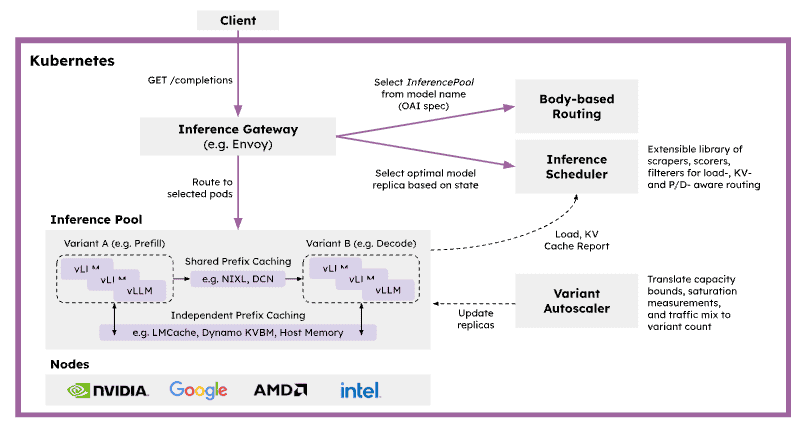
SOTA inference performance on any accelerator
A core tenet of the cloud native philosophy is preventing vendor lock-in. For AI infrastructure, this means serving capabilities must be hardware-agnostic.
We believe that democratizing SOTA inference with an accelerator-neutral mindset is the most important enabler for broad LLM adoption. The primary mission of llm-d is to Achieve SOTA Inference Performance On Any Accelerator. By introducing model- and state-aware routing policies that align request placement with specific hardware characteristics, llm-d maximizes utilization and delivers measurable gains in critical inference metrics like Time to First Token (TTFT), Time Per Output Token (TPOT), token throughput, and KV cache utilization. Whether you are running workloads on accelerators from NVIDIA, AMD, or Google, llm-d ensures that high-performance AI serving remains a core, composable capability of your stack.
Crucially, clear benchmarks that prove the value of these optimizations are core to the project. The AI industry often lacks standard, reproducible ways to measure inference performance, relying instead on marketing claims or commercial analysts. llm-d aims to be the neutral, de facto standard for defining and running inference benchmarks through rigorous, open benchmarking. For example, in a ‘Multi-tenant SaaS’ use case, shared customer contexts enable significant computational savings through prefix caching. As demonstrated in the most recent v0.5 release, llm-d’s inference scheduling maintains near-zero latency and massive throughput compared to a baseline Kubernetes service:
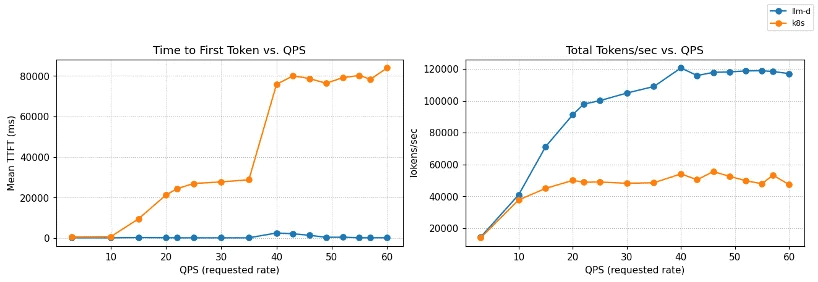
Figure 1: TTFT and throughput vs QPS on Qwen3-32B (8×vLLM pods, 16×NVIDIA H100).
llm-d inference scheduling maintains near-zero TTFT and scales to ~120k tok/s,
while baseline Kubernetes service degrades rapidly under load.
Bridging cloud native and AI native ecosystems
To build the ultimate AI infrastructure, we must bridge the gap between Kubernetes orchestration and frontier AI research. llm-d is actively building deep relationships with AI/ML leaders at large foundation model builders and AI natives, along with traditional enterprises that are rapidly integrating AI throughout their organizations. Furthermore, we are committed to increasing collaboration with the PyTorch Foundation to ensure a seamless, end-to-end open ecosystem that connects model development and training directly to distributed cloud native serving.
Get involved: Follow the “well-lit paths”
At its core, llm-d follows a “well-lit paths” philosophy. Instead of leaving platform teams to piece together fragile black boxes, llm-d provides validated, production-ready deployment patterns—benchmarked recipes tested end-to-end under realistic load.
We invite developers, platform engineers, and AI researchers to join us in shaping the future of open AI infrastructure:
- Explore the Well-Lit Paths: Visit the llm-d guides to start deploying SOTA inference stacks on your infrastructure today.
- Learn More: Check out the official website at llm-d.ai.
- Contribute: Join the community on slack and get involved in our GitHub repositories at https://github.com/llm-d/.
Welcome to the CNCF, llm-d! We look forward to building the future of AI infrastructure together.
Beyond Batch: Volcano Evolves into the AI-Native Unified Scheduling Platform
The world of AI workloads is changing fast. A few years ago, “AI on Kubernetes” mostly meant running long training jobs. Today, with the rise of Large Language Models (LLMs), the focus has shifted to include complex inference services and Autonomous Agents. The industry consensus, backed by CNCF’s latest Annual Cloud Native Survey, is clear: Kubernetes has evolved to become the essential platform for intelligent systems. This shift from traditional training jobs to real-time inference and agents is transforming cloud native infrastructure.
This shift creates new challenges:
- Complex Inference Demands: Serving LLMs requires high-performance GPU resources and sophisticated management to control costs and latency.
- Distinct Agent Requirements: AI Agents introduce “bursty” traffic patterns, requiring instant startup times and state preservation—capabilities not natively optimized in Kubernetes.
The Volcano community is responding to these needs. With the release of Volcano v1.14, Kthena v0.3.0, and the new AgentCube, Volcano is transforming from a batch computing tool into a Full-Scenario, AI-Native Unified Scheduling Platform.
1. Volcano v1.14: Breaking Limits on Scale and Speed
As clusters expand and workloads diversify, scheduler bottlenecks can degrade performance. Volcano v1.14 introduces a major architectural evolution to address this.
Scalable Multi-Scheduler Architecture
Traditional setups often rely on static resource division, leading to wasted capacity. Volcano v1.14 introduces a Sharding Controller that dynamically calculates resource pools for different schedulers (Batch, Agent, etc.) in real-time.
- Key Benefit: Enables running latency-sensitive Agent tasks alongside massive training jobs on the same cluster without resource contention, ensuring high cluster utilization and cost efficiency.
High-Throughput Agent Scheduling
Standard Kubernetes scheduling often struggles with the high churn rate of AI Agents. The new Agent Scheduler (Alpha) in v1.14 provides a high-performance fast path designed specifically for short-lived, high-concurrency tasks.
Enhanced Resource Efficiency
To optimize infrastructure costs, v1.14 adds support for generic Linux OSs (Ubuntu, CentOS) and democratizes enterprise features like CPU Throttling and Memory QoS. Additionally, native support for Ascend vNPU maximizes the utilization of diverse AI hardware.
2. Kthena v0.3.0: Efficient and Scalable LLM Serving
The CNCF survey has identified AI inference as the next major cloud native workload, representing the bulk of long-term cost, value, and complexity. Kthena v0.3.0 directly addresses this challenge, introducing a specialized Data Plane and Control Plane architecture to solve the speed and cost balance for serving large models.
Optimized Prefill-Decode Disaggregation
Separating “Prefill” and “Decode” phases improves efficiency but introduces heavy cross-node traffic.
- Key Benefit: Kthena leverages Network Topology Awareness to co-locate interdependent tasks (e.g., on the same switch). Combined with a Smart Router that recognizes KV-Cache and LoRA adapters, it ensures requests are routed with minimal latency and maximum throughput.
Simplified Deployment with ModelBooster
Deploying large models typically involves managing fragmented Kubernetes resources.
- Key Benefit: The new ModelBooster feature offers a declarative, one-stop deployment experience. Users define the model intent once, and Kthena automates the provisioning and lifecycle management of all underlying resources, significantly reducing operational complexity.
Cost-Efficient Heterogeneous Autoscaling
Running LLMs exclusively on top-tier GPUs can be cost-prohibitive.
- Key Benefit: Kthena’s autoscaler supports Heterogeneous Scaling, allowing the mixing of different hardware types (e.g., high-end vs. cost-effective GPUs) within strict budget constraints, optimizing the balance between performance and expenditure.
3. AgentCube: Serverless Infrastructure for AI Agents
While Kubernetes provides a solid infrastructure foundation, it lacks specific primitives for AI Agents. AgentCube bridges this gap with specialized capabilities.
Instant Startup via Warm Pools
Agents require immediate responsiveness that standard container startup times cannot match.
- Key Benefit: AgentCube utilizes a Warm Pool of lightweight MicroVM sandboxes. This mechanism reduces startup latency from seconds to milliseconds, delivering the snappy experience users expect.
Native Session Management
AI Agents require state persistence across multi-turn interactions, unlike typical stateless microservices.
- Key Benefit: Built-in Session Management automatically routes conversations to the correct context, seamlessly enabling stateful interactions within a stateless Kubernetes environment.
Serverless Abstraction
Developers need to focus on agent logic rather than server management.
- Key Benefit: AgentCube provides a streamlined API for requesting secure environments (like Code Interpreters). It handles the entire lifecycle—secure creation, execution, and automated recycling—offering a true serverless experience.
Conclusion
Volcano has evolved beyond batch jobs. With v1.14, Kthena, and AgentCube, we now provide a comprehensive platform for the entire AI lifecycle—from training foundation models to serving them at scale to powering the next generation of intelligent agents.
By embracing cloud native principles to deliver scalable, reliable infrastructure for the AI lifecycle, Volcano is contributing to the community’s goal of ensuring AI workloads behave predictably at scale. As organizations seek consistent and portable AI infrastructure (a concept championed by initiatives like the Kubernetes AI Conformance Program), Volcano is positioning itself as a core component of that solution.
We invite you to explore these new features and join us in building the future of AI infrastructure.
- Volcano GitHub: github.com/volcano-sh/volcano
- Kthena GitHub: github.com/volcano-sh/kthena
- AgentCube GitHub: github.com/volcano-sh/agentcube
If you are attending KubeCon + CloudNativeCon Europe, we encourage you to stop by our booth, P-14A, in the Project Pavilion to say hi and learn more about the latest updates.
Metal3 at KubeCon + CloudNativeCon Europe 2026: Meet the CNCF’s Freshly Incubated Bare Metal Project
Metal3 (pronounced “metal cubed”) entered 2026 as one of the newest incubating projects in the CNCF. As the foundational layer for infrastructure management in self-hosted Kubernetes clouds, Metal3 and its ‘stack’ offer essential solutions for cloud service providers, AI-focused distributed systems, edge cloud deployments, and telecom infrastructure. Given the increasing investment in compute infrastructure worldwide, Metal3 addresses a growing number of issues faced by the modern IT industry.
From the start, Metal3 set the ambitious goal of becoming the primary tool for Kubernetes bare metal cluster management across the broader cloud native ecosystem. Real-world feedback is necessary to achieve this, and the community remains committed to increasing the project’s visibility and adoption. Metal3 is at the forefront of automated bare metal lifecycle management and the community is aiming to assist others in achieving the same level of success.
If you’re attending, KubeCon + CloudNativeCon Europe is the perfect opportunity to get better acquainted with Metal3, ask questions, and connect with maintainers and community members. This year’s conference will be one of the most active events yet for Metal3 ever, with a record number of talks and touchpoints for anyone interested in learning about the project.
A packed Metal3 presence at KubeCon + CloudNativeCon Europe
Metal3 has organized a packed presence at the conference, offering a variety of opportunities for attendees to engage with the project. For a quick overview, a concise project status update will be delivered during the lightning talk. For those interested in deeper engagement, there are two in-depth sessions focusing on the project’s governance and path to CNCF Incubation and a real-world adoption use case from the Sylva Project. Additionally, you can meet maintainers and community members for questions and hallway-track conversations at the Metal3 kiosk on the Solutions Showcase floor.
Lightning talk
The first event of the week, a lightning talk, will take place on Monday, 23 March. In classic Metal3 fashion, the community will share a quick status report of the Metal3 project, focusing on future plans toward graduation and beyond, along with highlights of major developments on the roadmap.
If you’re new to Metal3, this session is a great entry point; it’s short, focused, and gives you the “what’s happening” overview you need before you take a deeper dive.
Two in-depth sessions: governance and adoption
In addition to the lightning talk, community members will be presenting two more in-depth sessions around Metal3 governance and adoption.
1) Metal3.io’s Path to CNCF Incubation: Governance, Processes, and Community
Presented by Metal3 maintainers, this session focuses on Metal3’s journey from CNCF Sandbox to Incubation through the lens of governance, processes, and community building.
Be sure to attend if you’re interested in:
- How Metal3 is run as an open-source project
- What changed (or matured) during incubation readiness
- How decisions are made and contributions flow
2) Beyond the Cloud: Managing Bare Metal the Kubernetes Way Using Metal3.io: Sylva Project as a Use Case
This talk approaches Metal3 from the viewpoint of an adopter. The hosts will explain the operational reality and practical use cases of a telco project and Metal3’s role.
Don’t miss this session if you care about:
- What adopting Metal3 looks like in practice
- The value proposition of Kubernetes-native bare metal lifecycle management
- Lessons learned and patterns from real usage in a telco project
Visit the Metal3 kiosk
You can also meet maintainers and community members at the Metal3 kiosk P-21B on the Solutions Showcase floor, from Tuesday, 24 March, to the morning of Thursday, 26 March. This is a great opportunity to connect directly with the people building and operating the project. Whether you have technical queries about implementation, operational questions about running Metal3 in production, governance-related inquiries about its CNCF journey, or if you are simply curious about the project’s future, the kiosk is one of the easiest ways to get answers and context quickly.
Join the conversation
Whether you’re attending KubeCon + CloudNativeCon Europe to learn, evaluate, contribute to, or compare approaches for managing the lifecycle of bare metal Kubernetes, this event is shaping up to be a key moment for Metal3.
Stop by the kiosk, catch the lightning talk, and join one (or both!) of the longer sessions
The community is eager to meet users and contributors and to discuss the future of bare metal Kubernetes. We welcome new contributors and adopters to our continuously growing community, inviting everyone working with bare metal Kubernetes to share their use cases and feedback. Whether you are already running Metal3 in production or just starting to explore, the community welcomes everyone’s input as an adopter, operator, or contributor. Learn more about how you can get active by visiting: https://metal3.io/contribute.html
See you at the conference!
Crossplane and AI: The case for API-first infrastructure
AI-assisted development has changed the way engineers create and commit code. But writing code is no longer the bottleneck. The bottleneck is everything that happens after git push.
From infrastructure provisioning, policy enforcement, day-two operations, drift, compliance, to cross-team coordination. That still requires multiple steps, and no new tool will fix it. This is an architecture problem. AI needs APIs, not UIs, and most platforms still aren’t built that way.
Current platforms
Talk to almost any organization, and you’ll hear that the desired state lives in Git, while the actual state lives in cloud providers. Policies are buried in pipeline configs. Organizational knowledge exists in wikis no one reads and in engineers who eventually leave.
This has worked up to now because humans worked with humans to navigate the context switching and informal coordination required to get the job done. People fill in the gaps, ask the questions, and translate intent across systems.
But in a world where AI agents are embedded into our organizations, this workflow breaks down. The agent hits a wall, not because it lacks capability, but because the platform wasn’t built for programmatic access. It was built for humans who can compensate for inconsistency.
Agents require a unified, structured, machine-readable interface. They need explicit governance rules, readable historical patterns, and discoverable dependencies. Without that structure, autonomy stalls.
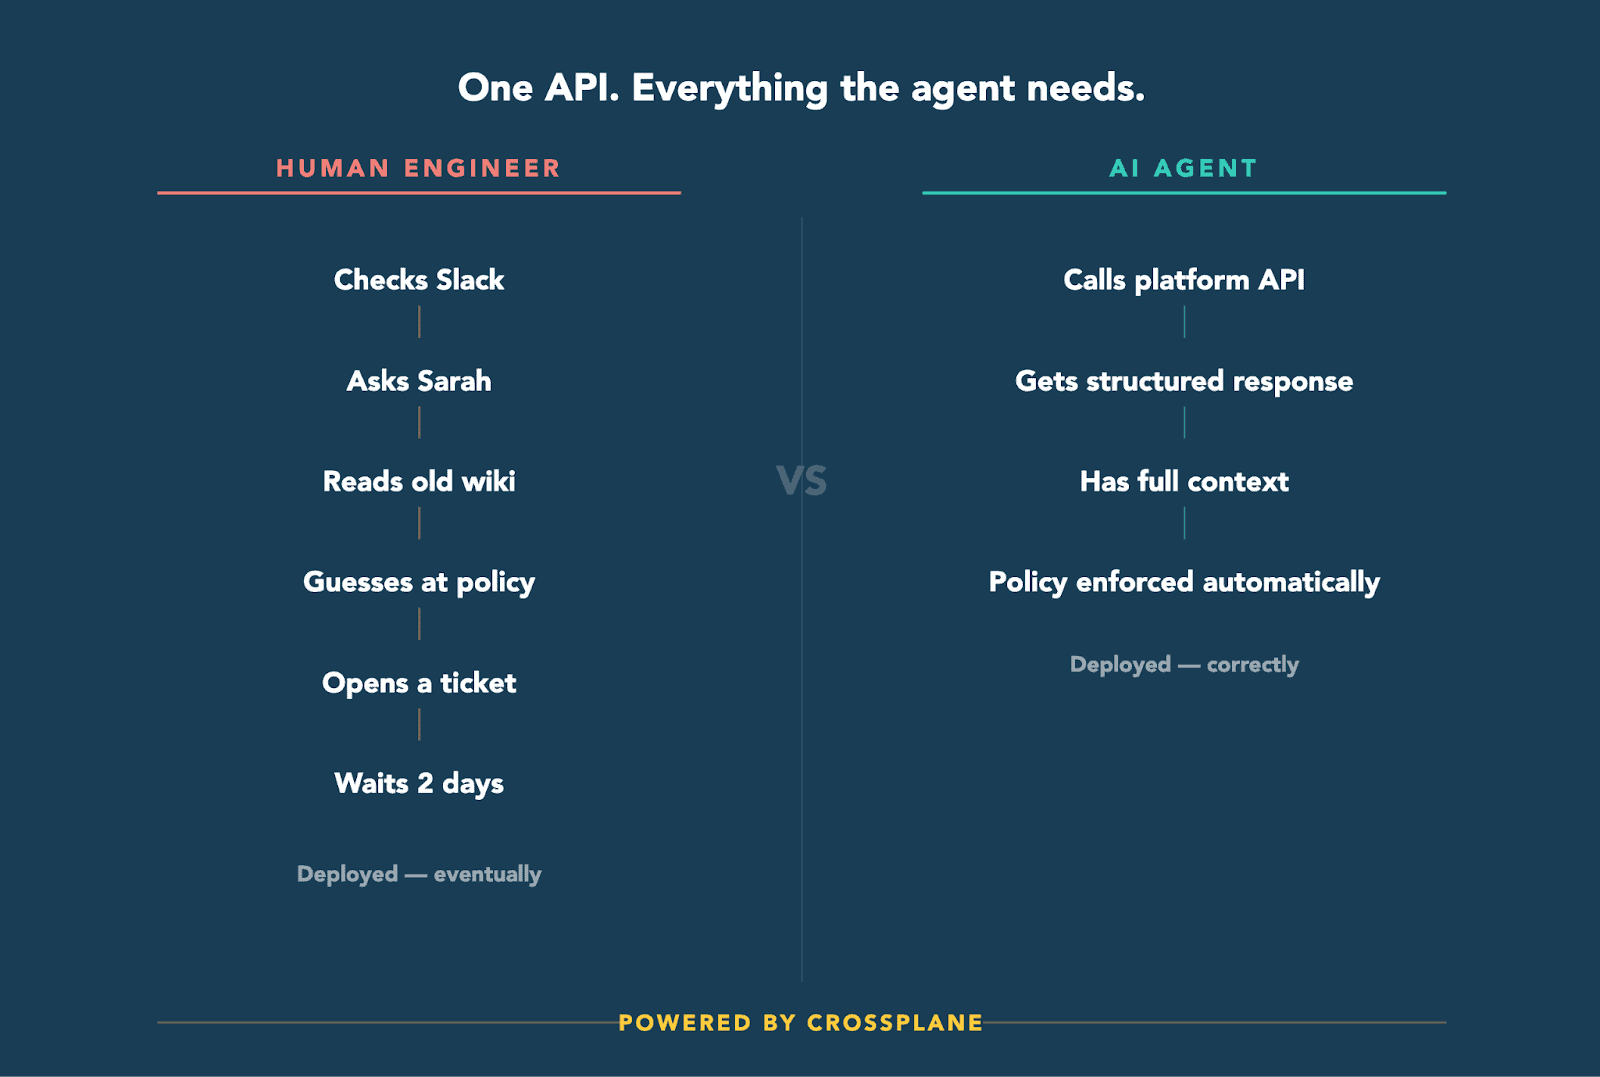
Platforms built on declarative control
Kubernetes introduced a simple but powerful control pattern that changes this entirely. Every resource follows a consistent schema:
yaml
apiVersion: example.crossplane.io/v1
kind: Database
metadata:
  name: user-db
spec:
  engine: postgres
  storage: 100Gi
Desired state lives in spec, actual state is reflected in status, and controllers observe the difference and reconcile continuously. That reconciliation is consistent and automatic; no human is required to coordinate convergence.
Crossplane extends this model beyond containers to all infrastructure and applications: cloud databases, object storage, networking, SaaS systems, clusters, and custom platform APIs. The result isn’t just infrastructure-as-code. It’s your entire platform, infrastructure, and applications as a single API. That difference matters.
The three core elements that make this work in practice:
- Desired state: the declarative specification of what we think the world should be. (Example: The frontend service should have 3 replicas with 2 GB of memory each.)
- Actual state: the operational reality of what exists in the infrastructure. (Example: The frontend service has 2 healthy replicas, 1 pending.)
- Policy: the rules and governance that constrain operations. (Example: Production changes require approval between 9 AM and 5 PM PST.)
Controllers continuously reconcile desired state with actual state, and policy is enforced at execution rather than left to manual review. Context becomes part of the system, not something external to it.
Why this model works for agents
An AI agent interacting with a Crossplane-managed platform doesn’t need to orchestrate workflows across multiple systems. It interacts with a single API surface.
It can discover resource types via the Kubernetes API, inspect status fields for real-time operational state, watch resources for change events, and submit declarative intent. Since reconciliation handles mechanical execution, agents don’t need to coordinate step-by-step logic; they just declare intent and let controllers handle convergence.
This separation of concerns is critical. Controllers handle mechanics, while agents focus on higher-level reasoning. Without a control plane, agents become fragile orchestrators. With one, they become declarative participants.
When the entire platform is accessible through a single, consistent API, the agent has everything it needs. No Slack messages and no tribal knowledge required.
Policy at the point of execution
In fragmented platforms, governance follows lots of procedures: reviews, tickets, Slack threads. In a Kubernetes-native control plane, governance is architectural.
RBAC controls who can act. Admission controllers validate changes before they’re persisted. Policy engines such as OPA and Kyverno enforce constraints at runtime. Crossplane compositions encode organizational patterns directly into APIs. Every change flows through the same enforcement path, no hidden approval steps, no undocumented exception paths.
This removes ambiguity for agents entirely. The system defines what is allowed. Agents operate within clearly defined boundaries, and the platform enforces them automatically.
Crossplane 2.0: Full-stack control
With Crossplane 2.0, compositions can include any Kubernetes resource, not just managed infrastructure. That means a single composite API can provision infrastructure, deploy applications, configure networking, set up observability, and define operational workflows, all in one place.
apiVersion: platform.acme.io/v1
kind: Microservice
metadata:
  namespace: team-api
  name: user-service
spec:
  image: acme/user-service:v1.2.3
  database:
    engine: postgres
    size: medium
  ingress:
    subdomain: users
Behind that abstraction may live RDS instances, security groups, deployments, services, ingress rules, and monitoring resources. To a human developer or an AI agent, it’s a single API. That consistency is what enables automation to scale safely.
Day-two operations follow the same pattern. Crossplane’s Operation types bring declarative control to scheduled upgrades, backups, maintenance, and event-driven automation:
apiVersion: ops.crossplane.io/v1alpha1
kind: CronOperation
metadata:
  name: weekly-db-maintenance
spec:
  schedule: "0 2 * * 0"
  operationTemplate:
    spec:
      pipeline:
        - step: upgrade
          functionRef:
            name: function-database-upgrade
Operational workflows are now first-class API objects. Agents can inspect them, trigger them, observe their status, and propose modifications. No need for hidden runbooks.
Where to start
This doesn’t require a start-from-scratch migration. Bring core infrastructure under declarative control first. Your existing resources don’t need to be replaced; they just need to be unified behind a consistent API.
For teams using AI-assisted development, engineers express intent and iterate quickly as tools accelerate implementation. As deployment decouples from release, with changes shipping behind feature flags and systems reconciling toward the desired state, the platform must be deterministic and self-correcting, not reliant on someone catching drift or running the right command at the right time.
That is what a declarative control plane provides. Crossplane ensures that intent has somewhere safe, structured, and deterministic to land. Without it, AI will always be bolted onto human-centric workflows. With it, agents become first-class participants in infrastructure operations.
And that starts with a consistent API.
And that starts with a consistent API. Get started by checking out the Crossplane Docs, attending a community meeting, or watching CNCF’s Cloud Native Live on Crossplane 2.0 – AI-Driven Control Loops for Platform Engineering.
Sustaining open source in the age of generative AI
Open source has always evolved alongside shifts in technology.
From distributed version control and CI/CD, from containers to Kubernetes, each wave of tooling has reshaped how we build, collaborate, and contribute. Generative AI seems to be the newest wave and it introduces a tension that open source communities can no longer afford to ignore.
AI has made it simple to generate contributions. It has not however made the necessary review process simpler.
Recently, the Kyverno project introduced an AI Usage Policy. This decision was not driven by resistance to AI. It was driven by something far more practical: the scaling limits of human attention.
Where this conversation began
Like many governance changes in open source, this one didn’t begin with theory. It began with a Slack message.
“20 PRs opened in 15 minutes ?”
What followed was a mixture of humor, curiosity, and a familiar undertone many maintainers recognize immediately as discomfort.
“Were they good PRs?”
“Maybe they were generated by bots?”
“Are any of them helpful or are mostly they noise?”
One maintainer captured the sentiment perfectly:
“Just seeing this number is discouraging enough.”
Another jokingly suggested we might need a:
“Respect the maintainers’ life policy.”
Behind the jokes was something deeply real. Our Maintainers and our project at large were feeling the weight of something very new, very real, and clearly on the verge of changing how open source projects like ours will be maintained.
The maintainer reality few people see
Modern AI tools are extraordinary productivity amplifiers.
They generate code, documentation, tests, refactors, and design suggestions in seconds. But while output scales infinitely, review does not. The bottleneck in open source has never been code generation.
It has always been human cognition.
Every pull request, regardless of how it was produced must still be:
- Read
- Understood
- Evaluated for correctness
- Assessed for security implications
- Considered for long-term maintainability
- More often than not, commented on, questioned, or simply clarified
- Viewed by more than one set of eyes
- Merged
In open source, there is always a human in the loop. That human is typically a maintainer, a reviewer, or a combination of both.
When low-effort or poorly understood AI-generated PRs flood a project, the burden of validation shifts entirely onto the humans who bear the majority of the weight in this loop. Even the most well-intentioned contributions become costly when they lack clarity, context, demonstrated understanding, and ownership.
Low-effort AI contributions don’t just exhaust maintainers, they quietly tax every thoughtful contributor waiting in the queue.
AI boomers, AI rizz, and the reality of change
We’re currently living through a fascinating cultural split in the developer ecosystem.
On one side, we see what might playfully be called “AI boomers” otherwise known as those folks deeply skeptical of AI, hesitant to adopt it, or resistant to its growing presence in development workflows. While it might be hard to believe, there are many of these people working in and contributing to open source software development.
On the other side, we see contributors with undeniable “AI rizz.” These are enthusiastic adopters of AI eager to automate, generate, accelerate, and experiment with AI and AI tooling in the open source space and everywhere else possible.
Both reactions are understandable.
Both are human.
But history has taught us something consistent about technological change:
Projects, like businesses, that refuse to adapt rarely remain relevant.
It’s become clear that AI is not a passing trend. It is a structural shift in how software is created. Resisting it entirely is unlikely to be sustainable and blindly embracing it without guardrails is equally risky.
AI as acceleration vs. AI as substitution
Open source contributions have traditionally served as one of the most powerful learning engines in our industry. Developers deepen expertise, explore systems, build portfolios, and give back to the communities they rely on.
But it seems that the arrival of AI has changed how many contributors produce work. The unfortunate thing is that this hasn’t happened in a globally productive way, rather it has happened in a way that undermines the one thing that a meaningful contribution requires:
Understanding.
Using AI to bypass understanding is not acceleration. It’s debt for both the contributor and the project.
Superficially correct code that cannot be explained, reasoned about, or defended introduces risk. It also deprives contributors of the very growth that open source participation has historically enabled.
Across open source communities, we’re hearing the same message shared with AI touting contributors: AI can amplify learning but it cannot replace learning.
Ownership still matters — perhaps more than ever
During an internal discussion about AI-generated contributions, Jim Bugwadia, Nirmata CEO and Kyverno founder, made a deceptively simple observation about what needs to happen with AI generated and assisted contributions:
“Own your commit.”
In a world of AI-assisted development, that idea expands naturally.
If AI helped generate your contribution, you must also own your prompt and whatever is generated by it.
Ownership means:
- Understanding intent
- Verifying correctness
- Taking responsibility for outcomes
- Standing behind the change
AI can generate output but it can’t and shouldn’t assume accountability. The idea of having a human in the loop isn’t something that can or should ever be only Maintainer facing. To be fair, this concept must be Contributor facing too.
Disclosure as trust infrastructure
Transparency has always been foundational to open source collaboration.
AI introduces new complexities around licensing, copyright, provenance, and tool terms of service. Legal frameworks are still evolving, and uncertainty remains a defining characteristic of this space.
Disclosure is not about tools or bureaucracy.
Disclosure is about accountability. It is trust infrastructure.
Requiring contributors to disclose meaningful AI usage helps preserve:
- Transparency
- Reviewer trust
- Licensing integrity
- Contribution clarity
- Responsible authorship
This approach aligns with guidance from the Linux Foundation and discussions across the broaderCNCF community, both of which acknowledge that AI-generated content can be contributed provided contributors ensure compliance with licensing, attribution, and intellectual property obligations.
When AI meets open source: Kyverno’s approach
Kyverno is not a hobby project. Our project is used globally, in production, across organizations ranging from startups to enterprise-scale companies. Adoption continues to grow, and the project is actively moving toward CNCF Graduation.
Kyverno itself exists to create:
- Clarity
- Safety
- Consistency
- Sustainable workflows
All through policy as code.
In this case, we are applying the same philosophy to something new: AI usage.
If policy as code provides guardrails and golden paths in platform engineering, then we should be considering how to provide similar guidance in the AI-assisted development space.
Developers can’t sustainably leverage AI within open source ecosystems if projects fail to define the appropriate expectations for them to keep in mind as they develop.
AI-friendly does not mean AI-unbounded
There is an important distinction emerging across open source communities: Being AI-friendly does not mean accepting unreviewed AI output.
Maintainers themselves are often enthusiastic adopters of AI tools and rightly so. Across projects, maintainers are using AI to:
- Accelerate repetitive tasks
- Improve documentation
- Generate scaffolding
- Explore design alternatives
One emerging pattern is the use of AGENT.md-style configurations, designed to guide how AI tools interact with repositories and project conventions.
Kyverno is actively exploring similar approaches. The goal is not simply to manage AI-assisted contributions, but to improve their quality at the source.
Discomfort, growth, and privilege
AI is forcing open source communities to confront unfamiliar challenges:
- Scaling review processes
- Defining authorship norms
- Navigating licensing uncertainty
- Re-thinking contributor workflows
Discomfort is inevitable. But as Jim often reminds our team:
“Discomfort in newness is typically a sign of growth.”
The pressure to navigate these new challenges and answer these pressing questions is not a burden. Raising to this challenge is a privilege. It means:
- Our project matters
- The ecosystem is evolving
- We’re participating in shaping the future
A shared challenge across open source
Kyverno’s AI policy work was informed by thoughtful discussions and examples across the ecosystem. We dove into a variety of projects, each reflecting different constraints and priorities for us to keep in mind as we embark on our own journey.
Moving forward, what matters most, is that communities and community members from different projects and industries around the globe engage deliberately with these questions rather than simply responding reactively to the tooling.
Open source sustainability increasingly depends on shared governance patterns, not isolated experimentation.
An invitation to the ecosystem
AI is not going away, nor should it.
The question is not whether AI belongs in open source. The question is how we integrate it responsibly.
Sustainable open source in the AI era requires:
- Human ownership
- Transparent authorship
- Respect for reviewer time
- Context-aware contributions
- Community-driven guardrails
AI is a powerful tool. But open source remains at its core, a human system.
While AI changes the tools and accelerates output, it does not change the responsibility.
Acknowledgements and influences
Kyverno’s AI Usage Policy was shaped by the openness and thoughtfulness of many communities and leaders, including:
- Ghostty
- KubeVirt
- Linux Foundation working groups
- QEMU maintainers
- Mitchell Hashimoto’s writings on AI adoption
Open source benefits enormously when governance knowledge is shared. Thanks to everyone who has already shared and to those who will help us continue to adapt our AI policies as we grow our project.